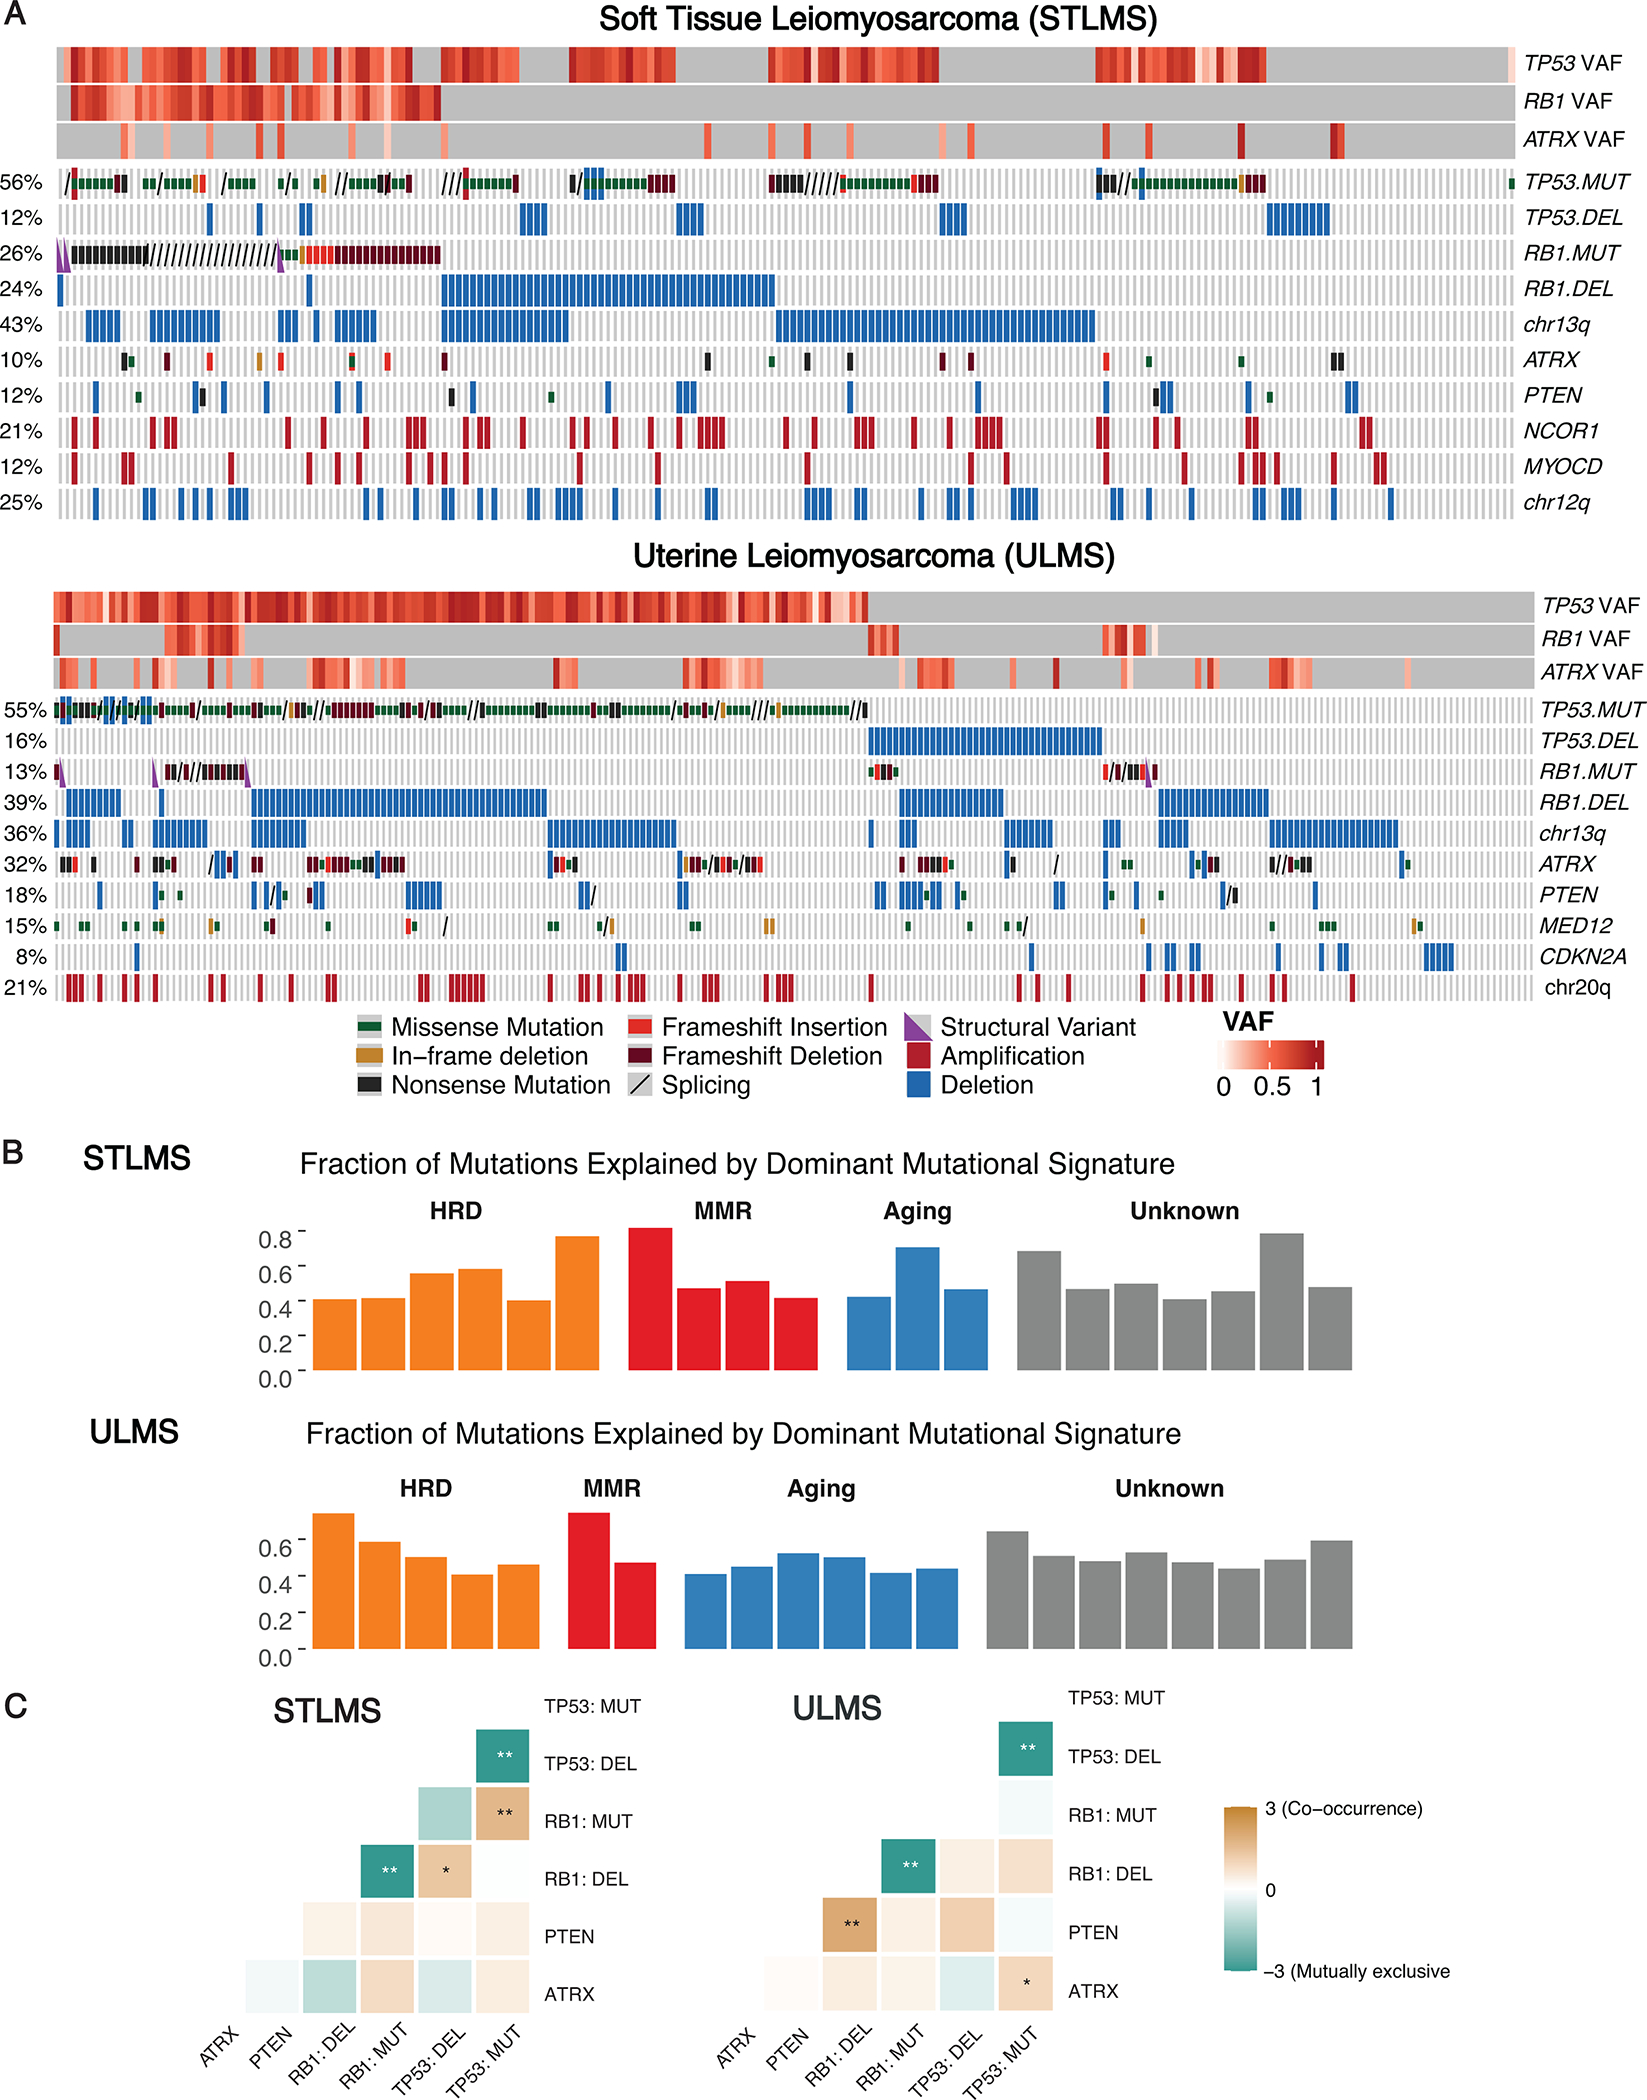
Figure 1.

Spectrum of genomic alterations in STLMS and ULMS.
A. Genomic alterations in soft tissue (STLMS) and uterine leiomyosarcomas (ULMS). OncoPrint depicts key gene-level alterations and chromosomal arm level copy number variations. Variant allele frequency (VAF) of TP53, RB1, and ATRX mutations are represented by heatmaps. B. Individual STLMS and ULMS tumors harboring dominant mutation signatures. Bar charts display the fraction of mutations explained by the mutational signature. C. Mutual exclusivity and co-occurrence plots for the most frequent genomic alterations detected in STLMS and ULMS. Color of heatmap represents log2 odds ratio (* P < 0.05; ** P < 0.01).
