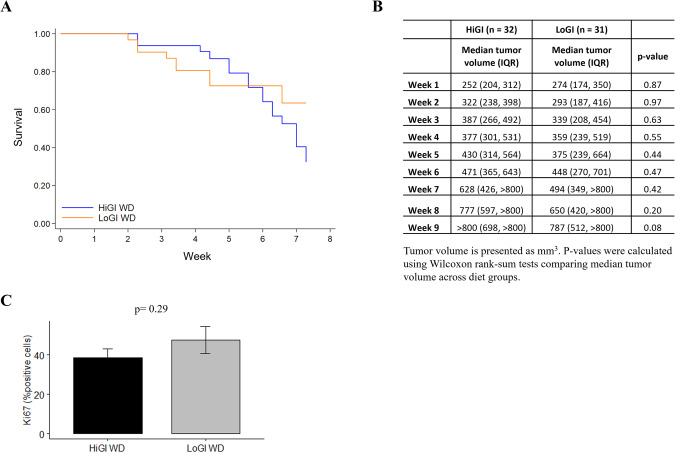
Fig. 1. Impact of glycemic index on survival and tumor growth in mice with PC.
A Kaplan–Meier survival curves for survival stratified by group. Differences between groups were tested using a log-rank test. B Summary statistics for tumor volume stratified by diet. P-values were calculated using Wilcoxon rank-sum tests comparing median tumor volume across diet groups. C Quantification of tumor Ki67 expression detected by immunohistochemistry. Values are presented as the mean of each group. Error bars represent standard deviation. Mean comparison was done by Two sample t test.

