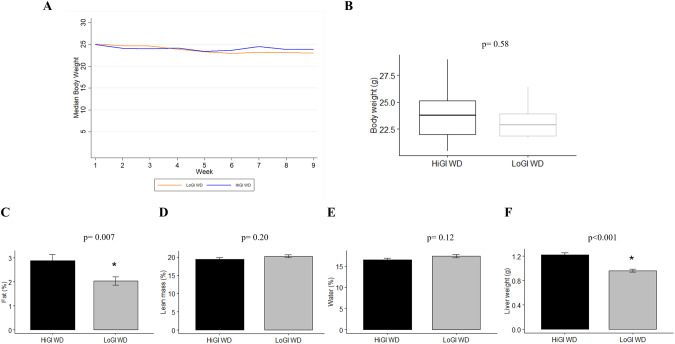
Fig. 2. Effect of experimental diets on body weight, body composition and liver weight.
A Mice were weighed twice per week. Values are presented as median body weight of each group after being randomized to their diet. B–E Body weight and body composition on day 35 after diet randomization. Body composition was determined using quantitative magnetic resonance technology. F Livers from mice were weighed at sacrifice. In bar graphs (C–F), values are presented as the mean of each group. Error bars represent standard deviation. Two sample t test or Wilcoxon rank-sum test were used for group comparison (*P < 0.05).

