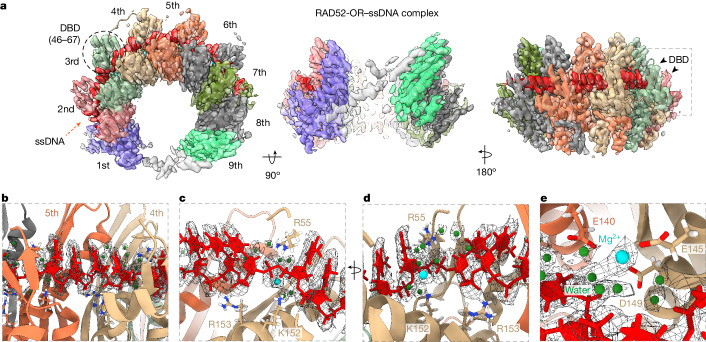
Fig. 3. Cryo-EM structure of the RAD52–ssDNA complex.
a, Top and side views of the RAD52–ssDNA complex cryo-EM map (2.3 Å) and atomic model. ssDNA is coloured red. The DBD is indicated on the third RAD52 subunit. b, Magnified view showing four ssDNA nucleotides (red) adopting the length of B-form DNA between two RAD52 monomers. c,d, Magnified view of ssDNA binding by Arg55, Lys152 and Arg153. e, Magnified view showing Mg2+ (cyan) and water molecules (green) coordinated by Glu140 (from a neighbouring RAD52 subunit), Glu145 and Asp149. The cryo-EM densities of ssDNA, Mg2+ and water molecules are presented as a mesh.

