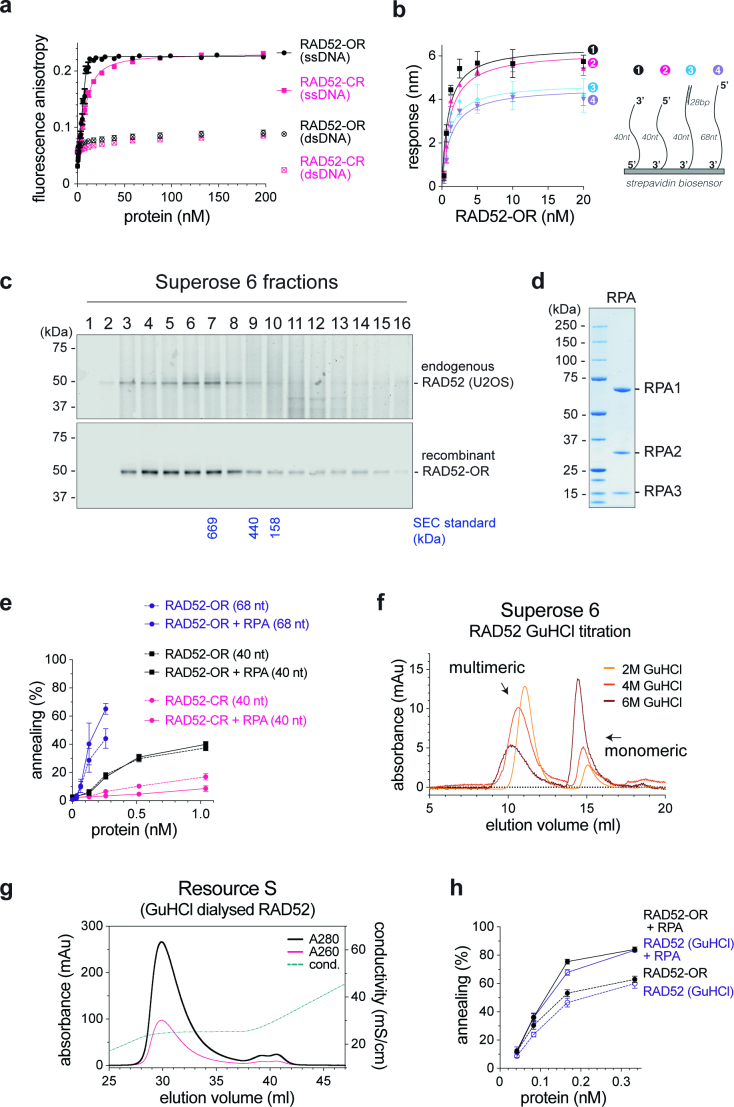
Extended Data Fig. 2. Single strand DNA annealing by RAD52.
a, RAD52-OR and RAD52-CR binding to 40 nt long ssDNA (10 nM, FAM-SSA4) or dsDNA (10 nM, FAM-SSA4/SSA5) measured by fluorescence anisotropy. Lines denote best quadratic curve fits. Each point and error bar denotes mean + s.e.m. (RAD52-OR-ssDNA, n = 6; RAD52-CR-ssDNA, n = 3; RAD52-OR-dsDNA, n = 3; RAD52-CR-dsDNA, n = 3). n values are independent experiments. b, RAD52-OR binding to the indicated biotinylated DNAs, as measured by biolayer interferometry. Lines denote 1:1 binding curve fits. Each point and error bar denotes mean + s.e.m. (n = 3). Equilibrium dissociation constants (KD) were: (1) 0.89 ± 0.35 nM, (2) 1.11 ± 0.4 nM, (3) 1.0 ± 0.55 nM and (4) 1.23 ± 0.41 nM. c, Size exclusion chromatography of a nuclear extract from U2OS cells compared with recombinant RAD52-OR. RAD52 was detected by Western blotting. d, SDS-PAGE of RPA. e, SSA using RAD52 (OR or CR) in the presence or absence of RPA with 68 or 40 nt ssDNA. Each point and error bar denotes mean + s.e.m. (RAD52-OR [68 nt] and RAD52-OR + RPA [68 nt], n = 3; RAD52-OR [40 nt] and RAD52-OR + RPA [40 nt], n = 9; RAD52-OR [40 nt] and RAD52-OR + RPA [40 nt], n = 3). n values are independent experiments. f, Superose 6 filtration of RAD52 following dialysis in 2, 4 and 6 M GuHCl. g, Resource S chromatography of RAD52 following GuHCl denaturation and refolding. h, SSA using renatured RAD52, as in Fig. 1f. Each point and error bar denotes mean + s.e.m. (RAD52-OR and RAD52-OR + RPA, n = 22; RAD52-OR [GuHCl] and RAD52-OR [GuHCl] + RPA, n = 3). n values are independent experiments.

