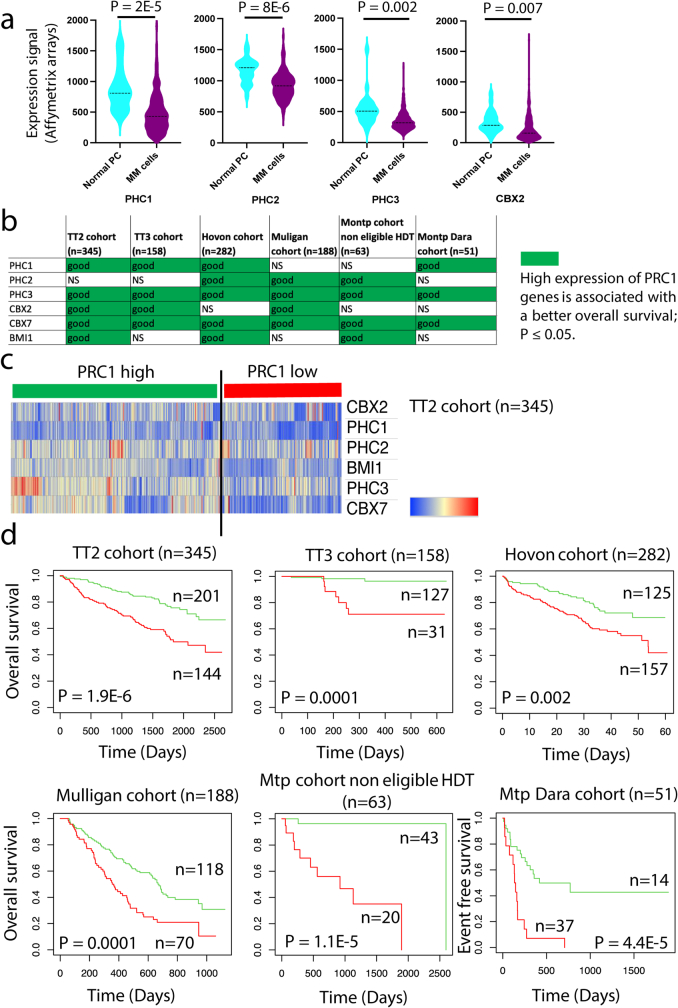
Extended Data Fig. 10. Tumour suppressive role of core PRC1 subunits in Multiple Myeloma.
a- PHC1, PHC2, PHC3 and CBX2 gene expression is significantly downregulated in malignant plasma cells (PCs) from patients with Multiple Myeloma (MM cells) compared to normal bone marrow PCs. Affymetrix U133 P gene expression profiles of purified bone marrow PC from 22 healthy donors and purified myeloma PCs from 345 previously untreated patients were compared using publicly available data (Gene Expression Omnibus, accession number GSE2658) from the University of Arkansas for Medical Sciences (UAMS, Little Rock, AR). Statistical difference was assayed using a two-sided Student t test. b- Prognostic value of core PRC1 components in MM. The prognostic value of PHC1, PHC2, PHC3, CBX2, CBX7, and BMI1 gene expression was analyzed in 6 independent cohorts of patients with MM using the Maxstat R function and Kaplan Meier survival curves as previously described. Low expression of PHC1, PHC2, PHC3, CBX2, CBX7 and BMI1 was associated with significantly shorter overall survival in at least three independent cohorts of MM patients out of the six studied (green colour). The six cohorts included gene expression data of purified MM cells from the TT2, TT3 (accession number E-TABM- 1138; GSE2658), and Hovon (accession number GSE19784) cohorts (345, 158 and 282 newly-diagnosed MM patients treated by high-dose melphalan and autologous hematopoietic stem cell transplantation); the Mulligan cohort (188 patients at relapse treated by proteasome inhibitor in monotherapy; GSE9782); the Mtp cohort non eligible to HDT (63 newly-diagnosed MM patients non eligible to high-dose melphalan and autologous hematopoietic stem cell transplantation) and the Mtp Dara cohort (51 patients at relapse treated by anti-CD38 monoclonal antibody (Daratumumab). c- The prognostic information of PHC1, PHC2, PHC3, CBX2, CBX7 and BMI1 genes was combined. Patients of the TT2 cohort (n = 345) were ranked according to the increased value of the calculated score and a cluster was defined. d- In the TT2 cohort, a maximum difference in overall survival was obtained, using the Maxstat R package, splitting patients into high-risk for 144 patients with the lowest expression of PRC1 genes and low-risk group for the 201 patients with higher PRC1 gene expression. Using the same parameter of the TT2 training cohort, we validated the association between low expression of PRC1 genes and a poor outcome in five other independent cohorts of patients with MM.

