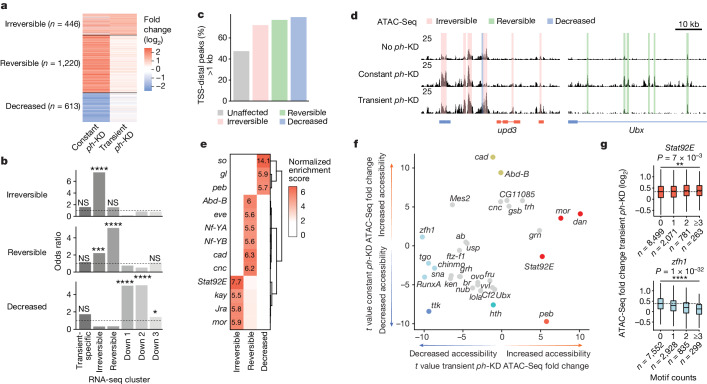
Fig. 4. Chromatin accessibility changes underlie reversible and irreversible transcriptional changes.
a, Clustering of ATAC-Seq peaks showing significant changes after constant or transient ph-KD. b, Over-representation of genes associated with irreversible (top), reversible (middle) or decreased (bottom) ATAC-Seq peaks, for each of the six RNA-seq clusters defined in Fig. 2b. One-sided Fisher’s exact test P values were corrected for multiple testing using FDR: *FDR < 5 × 10⁻², ***FDR < 1 × 10⁻³, ****FDR < 1 × 10⁻⁵, NS, P > 0.05. Exact FDR values: 2 × 10⁻¹, 4 × 10⁻²³, 1 × 10⁻¹, 1 × 100, 1 × 100, 1 × 100 (irreversible); 4 × 10⁻¹, 2 × 10⁻⁵, 2 × 10⁻³⁴, 1 × 100, 1 × 100, 3 × 10⁻¹ (reversible), 8 × 10⁻², 1 × 100, 1 × 100, 2 × 10⁻²¹, 5 × 10⁻³², 1 × 10⁻² (decreased). c, Fraction of TSS-distal peaks per cluster (greater than 1 kb). d, Screenshot of ATAC-Seq tracks after no ph-KD (control, top), constant (middle) or transient (bottom) ph-KD, at the irreversibly upregulated upd3 gene (left) and the reversibly upregulated Ubx gene (right). e, Normalized enrichment scores of DNA binding motifs found at each cluster of ATAC-Seq peaks (±250 bp, x axis). f, Linear model t values of DNA binding motifs associated with increased (positive t values) or decreased (negative t values) accessibility after transient (x axis) or constant ph-KD (y axis). Only motifs with a significant P < 1 × 10⁻⁵ in at least one of the two linear models are shown. g, Fold changes at ATAC-Seq peaks (y axis) on transient ph-KD, as a function of the number of Stat92E (left, in orange) or zfh1 (right, in blue) motifs that they contain (x axis). Two-sided Wilcoxon test: **P < 1 × 10⁻², ****P < 1 × 10⁻⁵. Box plots show the median (line), upper and lower quartiles (box) ±1.5× interquartile range (whiskers), outliers are not shown.

