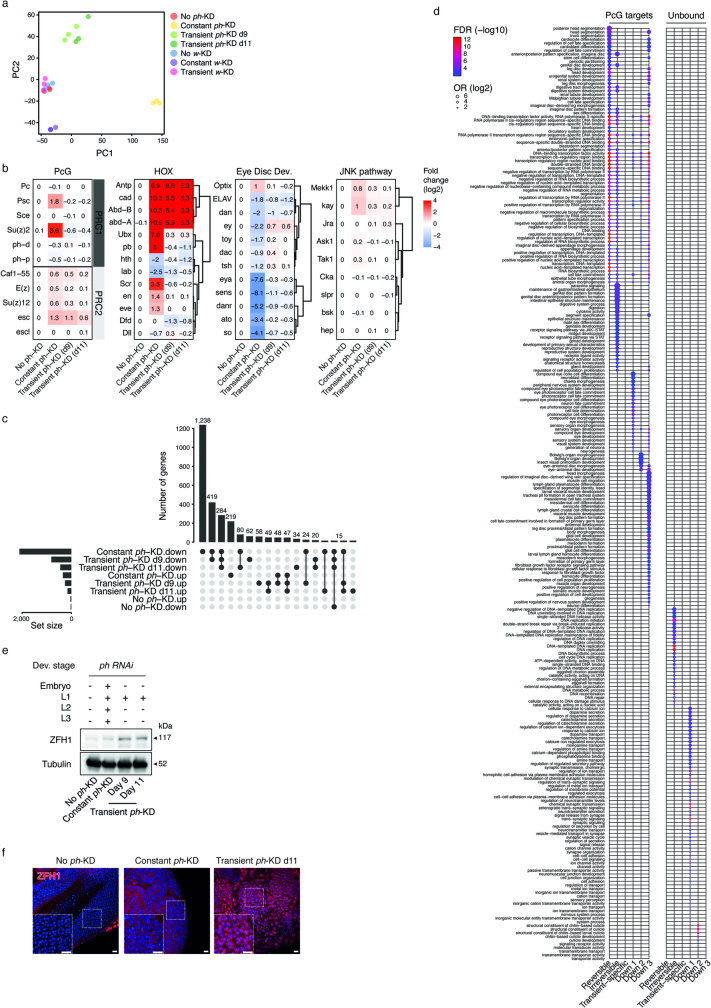
Extended Data Fig. 3. Transcriptional defects after constant or transient ph-KD include induction of ZFH1.
a- Principal component analysis (PCA) of normalized RNA-Seq read counts for different conditions. Each dot corresponds to one biological replicate. A close distance between samples reflects their similarity, showing that the control samples (no w-KD, no ph-KD) and the transient w-KD are very similar. b- Transcriptional fold changes after no ph-KD (control), constant or transient ph-KD (see x-axis) of the PcG core components, Hox genes (canonical targets of PcG repression), key genes that regulate ED development and the JNK pathway core members. c- Overlaps of differentially expressed genes between indicated RNA-Seq samples. Each vertical bar corresponds to an intersection (corresponding samples are shown below) and horizontal bars (bottom left) indicate the total number of differentially expressed genes in each sample. d- GO terms enriched for each gene cluster, then stratified as being direct PcG targets ( ≥ 50% of the gene body overlaps a H3K27me3 repressive domain) in control condition (left) or not (right). e- Western blot showing ZFH1 levels in EDs after no ph-KD (control), constant or transient ph-KD. Three independent experiments were performed with similar results. f- ZFH1 immunostaining (in red) after no ph-KD (control), constant or transient ph-KD. Tissues were counterstained with DAPI (in blue). Two independent experiments were performed with similar results. Scale bars: 10 μm.

