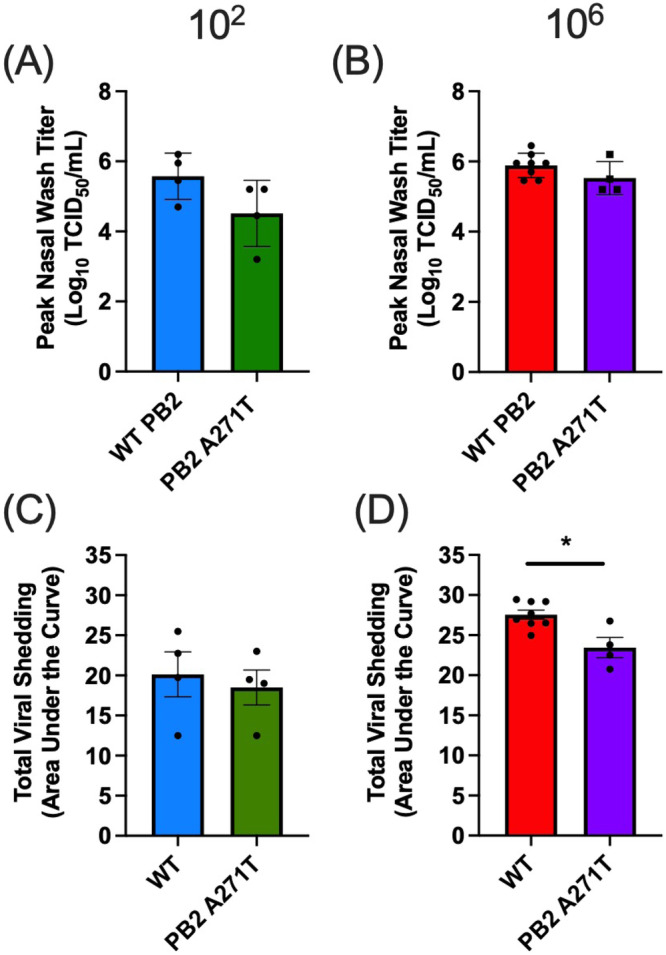
Fig. 6. Analyses of peak titers and total viral shedding for ferrets inoculated with wild-type or PB2 A271T A/mink (H5N1) virus.

A–D display peak viral titers and total viral shedding, respectively, for ferrets infected with either wild-type A/mink (H5N1) or A/mink (H5N1) with the PB2 A271T mutation. A, C show peak titers and total viral shedding, respectively, for ferrets infected at a dose of 102 TCID50 (n = 4/virus) in studies comparing viral shedding, weight loss, and survival (Fig. 4). B, D compared donor ferrets from both airborne transmission study 1 and 2 (combined n = 8) that were inoculated with wild-type A/mink (H5N1) to the donor ferrets for the transmission study with PB2 A271T A/mink (H5N1) (n = 4) virus. For all transmission studies, the inoculation dose in donors was 106 TCID50. Total viral shedding was determined via area under the curve (AUC) analyses of viral titers in the nasal wash from days 1–7. Values shown are mean ± SE. Peak titers and AUC values for each virus were compared using a two-tailed unpaired Student’s t test with Welch’s correction. *p = 0.039. Blue and green represent wild-type and PB2 A271T A/mink (H5N1), respectively, at an inoculation of 102, while red and purple represent the same viruses, respectively, at an inoculation dose of 106. Source data are provided as a Source Data file.
