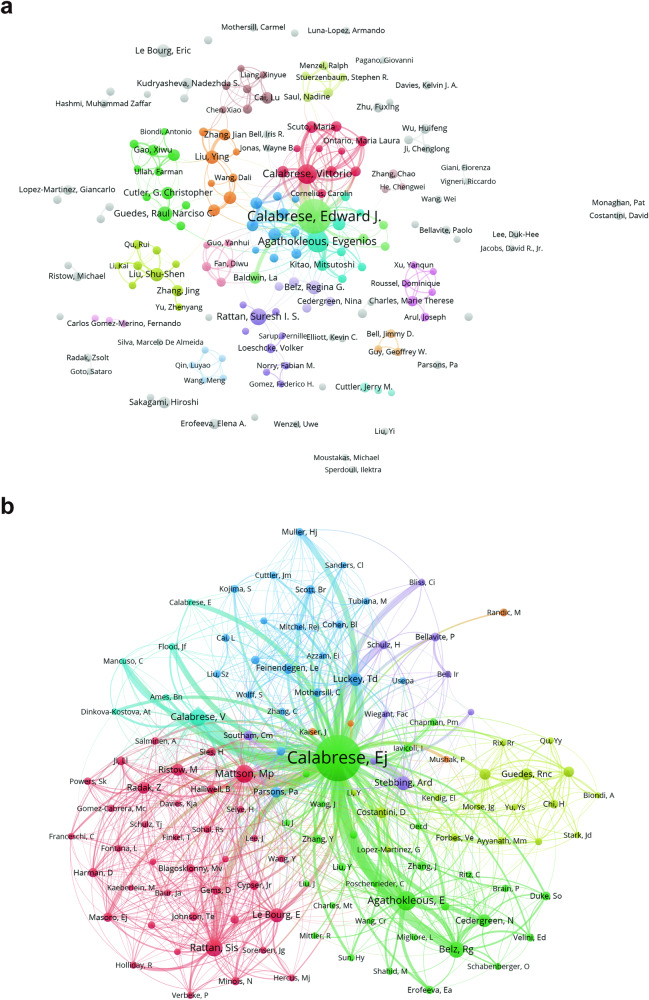
Fig. 4. The collaborative network of co-authors and co-cited authors was visualized using VOSviewer.
a The co-authors’ map of hormesis research provides a visual representation of the relationships between authors involved in the study. Each node, represented by a different color, corresponds to an author belonging to a specific cluster. The size of each node indicates the frequency of co-occurrence, while the connections between nodes represent the co-occurrence relationships among authors. b In the co-cited authors’ map of hormesis research, E.J. Calabrese occupies a central position, indicating their significant influence in the field. This map visualizes the co-cited relationships between authors, highlighting the similarities in their research interests and contributions.

