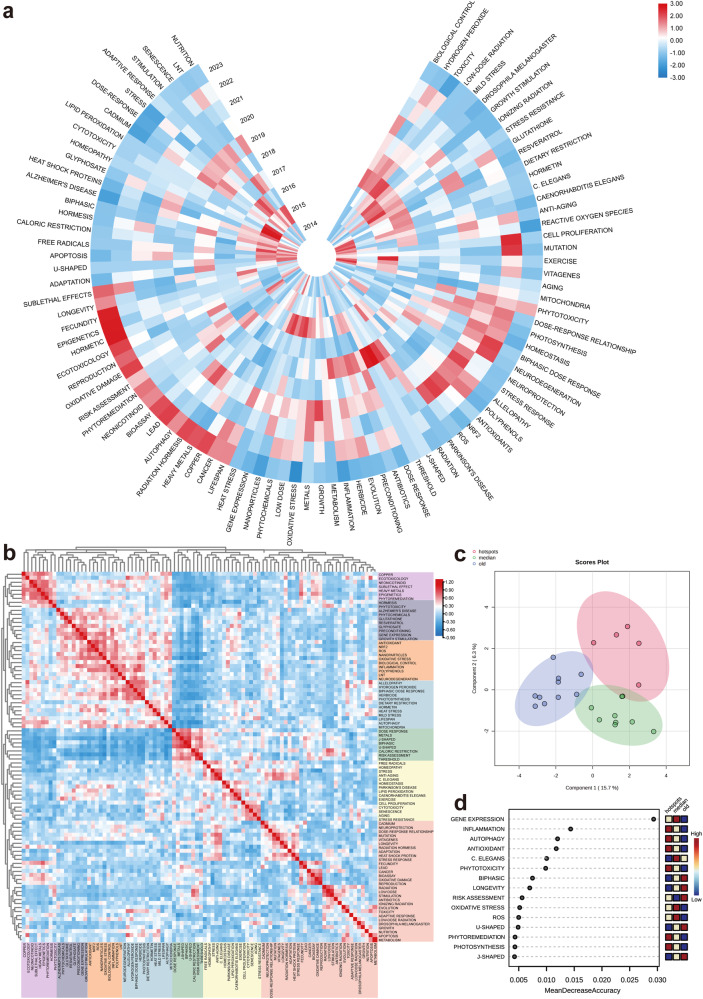
Fig. 7. The analysis of keywords related to hormesis.
a The annual heatmap of hormesis research illustrates the popularity of keywords between 2014 and 2023, measured by the ratio of yearly citation counts to total citation counts for each keyword. The red color indicates the highest levels of popularity. b The relevance heatmap of hormesis research illustrates the popularity of keywords. Keywords with high popularity during comparable periods are grouped into distinct categories and distinguished by varying colors. c The principal component analysis of hormesis research reveals the popularity of keywords. Keywords are categorized based on the year of occurrence and are represented by circles of three different colors. The distances between the individual points within each category indicate their relevance. d Conducting a heat analysis on keywords in the field of hormesis using the random forest method. The color distribution in the three columns to the right of each keyword row represents the dynamics of popularity over time.

