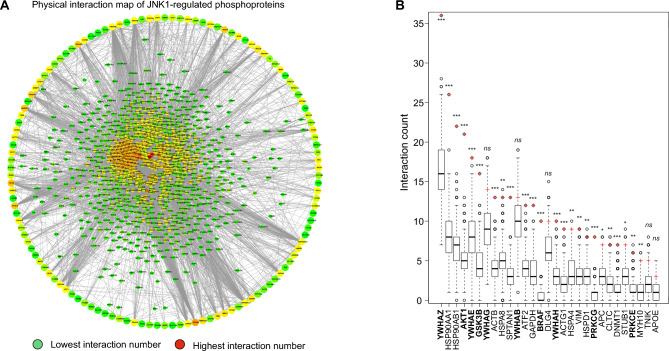
Figure 3.
Identification of signalling hubs downstream of JNK1 in mouse brain. (A) JNK1 regulated phosphoproteins from Jnk1-/- mouse brain are organised in a large outer circle with connections to the predicted interacting proteins in the centre. Warmer colours indicate a larger number of physical interactions, red being the highest. (B) Signalling hubs derived from the Jnk1-/- mouse brain phosphoproteome (labelled using gene names) represent the most highly connected phosphoproteins from among all phosphoproteins that are significantly altered in Jnk1-/- brain verses wild-type. For each hub, the distribution of physical interaction count from the 1000 background networks is represented with a boxplot. The number of physical interactions for the same hub in the Jnk1-/- mouse brain phosphoproteome (i.e. the phosphoproteins that are significantly altered in Jnk1-/- mouse brain phosphoproteome), is depicted with a red cross. The most highly ranked JNK1-regulated signalling hubs are shown.

