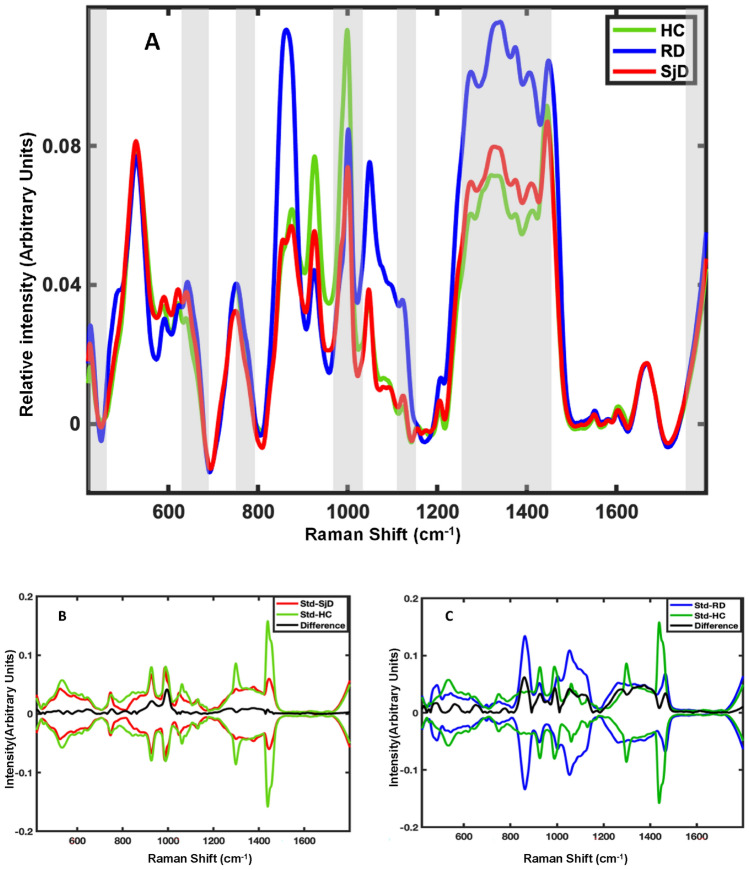
Figure 1.
(A) Pre-processed mean Raman spectra of saliva acquired from Healthy controls (HC-green), Radiation therapy patients (RD-blue) and Sjögren's disease patients (SjD-red). Areas selected by Genetic Algorithm are highlighted (transparent grey). (B) A difference spectrum between SjD and HC mean spectra (black), and one standard spectral deviation of SjD (red) and HC (green) spectra. (C) A difference spectrum between mean spectra of RD and HC (black), and standard spectral deviation of RD (blue) and HC (green).

