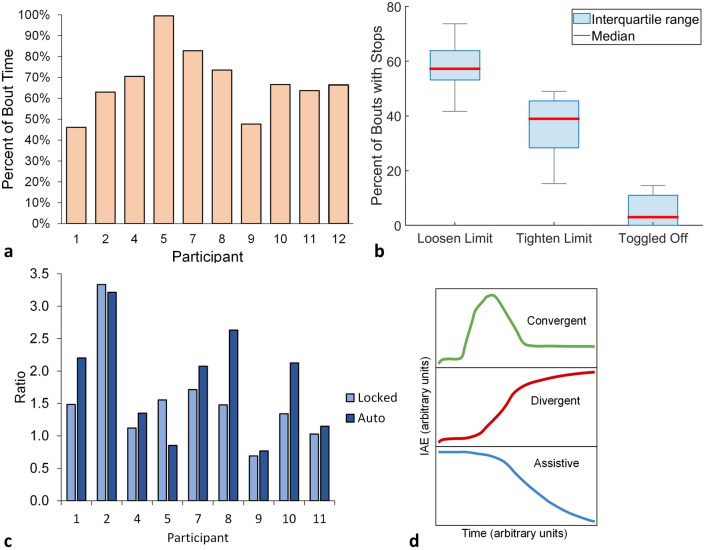
Figure 5.
(a–d) Controller performance. (a) Percentage time that the controller was active, i.e., not stopped by the controller rules nor the participant. (b) Percentage of bouts for which panel adjustment was temporarily stopped. Loosen limit: Adjustments stopped because controller rules were violated at the loosen limit. Tighten limit: Adjustments stopped because controller rules were violated at the tighten limit. Toggled off: The participant turned off the controller with the smartphone application. The gray bars indicate the maximum and minimum. (c) Quotient of the sum of the number of convergent and assistive bouts divided by the number of divergent bouts. (d) The three classifications of socket fit metric (SFM) response curves when the controller was activated included: A convergent response (green) was a rise to a maximum followed by a decrease that over time approached an approximately constant value, where the constant value was of greater magnitude than at the beginning of the bout. A divergent response (red) was a rise over time that did not maximize. An assistive response (blue) was a decrease over time that may or may not have reached a constant value.

