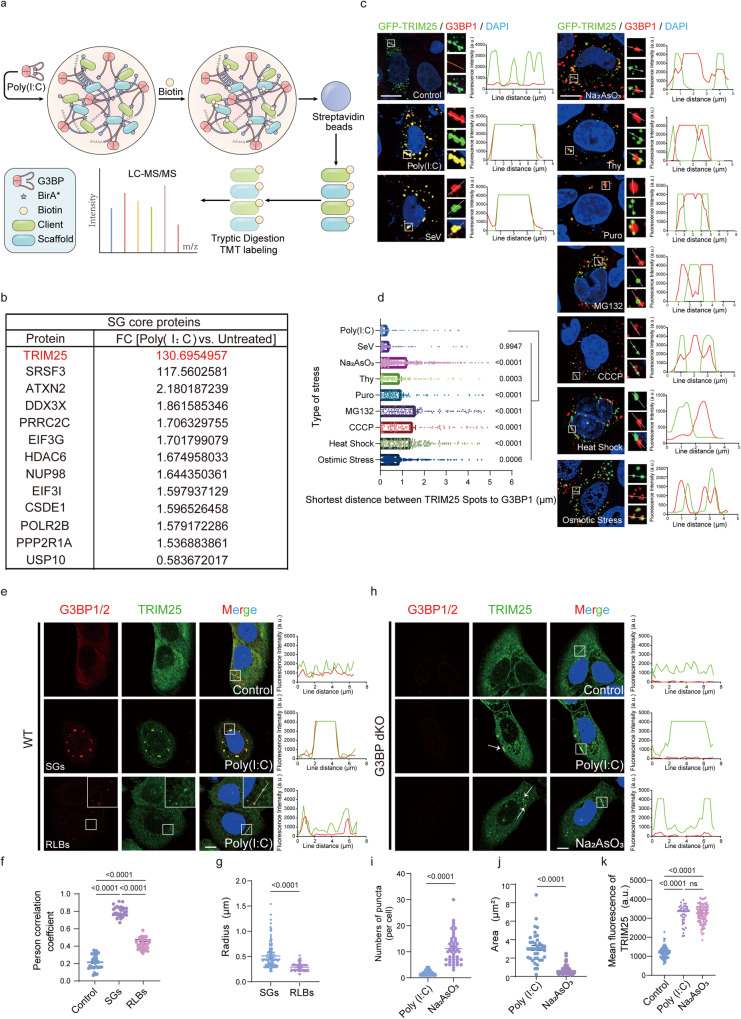
Fig. 1. The recruitment of TRIM25 to stress granules is predominately driven by RNA viruses or dsRNA.
a Schematic depicting G3BP1 BioID methodology coupled to TMT-based quantitative proteomics. b A list of SGs core proteins induced by poly(I:C) treatment, as determined in (a). c Representative fluorescence microscopy images showing the colocalization of TRIM25 with endogenous G3BP1 in HeLa cell upon various types of stress. For induction conditions see “Immunofluorescence microscopy and live-cell imaging” section. Inset: higher magnification of the white boxed area. d The shortest distance between TRIM25 and G3BP1 foci in HeLa cells as in (c). Sev infection and Poly(I:C) treatment led to the shortest distance, among all types of stress. (Poly(I:C), n = 205; SeV, n = 197; Na2AsO3, n = 403; Thy, n = 120; Puro, n = 114; MG132, n = 136; CCCP, n = 94; Heat Shock, n = 227; Osmotic Stress, n = 364). e–g Formation of endogenous TRIM25 and G3BP1 puncta in WT U2OS cells. Cells were transfected with or without 2 µg/ml of poly(I:C) for 6 h (e). Pearson’s correlation coefficient showing significant co-localization of endogenous TRIM25 with G3BP1 in SGs and RLBs (Control, n = 33; SGs, n = 31; Control, n = 34). f Radius statistics for SGs and RLBs, SGs (n = 128) vs. RLBs (n = 140): p value: 1.59e−021 (g). h–k Formation of endogenous TRIM25 puncta in G3BP dKO U2OS cells. White arrows indicate the TRIM25 puncta (h). Scatter plot of the numbers of TRIM25 puncta in G3BP dKO U2OS. Poly(I:C) (n = 44) vs. Na2AsO3 (n = 44): p value: 2.51e−017 (i). Statistical analysis of TRIM25 droplet areas in (h), Poly(I:C) (n = 39) vs. Na2AsO3 (n = 96): p value: 1.26e−027 (j). Fluorescence intensities of TRIM25 (Control, n = 33; Poly(I:C), n = 31; Na2AsO3, n = 34) (k). Data are representative of at least three independent experiments (c, e, h). Line scans show the related intensity profiles of TRIM25 and G3BP1. Scale bar, 10 µm (c, e, h). n represents the number of samples. (a.u. arbitrary units.) Mean ± s.e.m., statistical analysis was performed using two-tailed Student’s t test (g, i, j) or one-way ANOVA (d, f, k).

