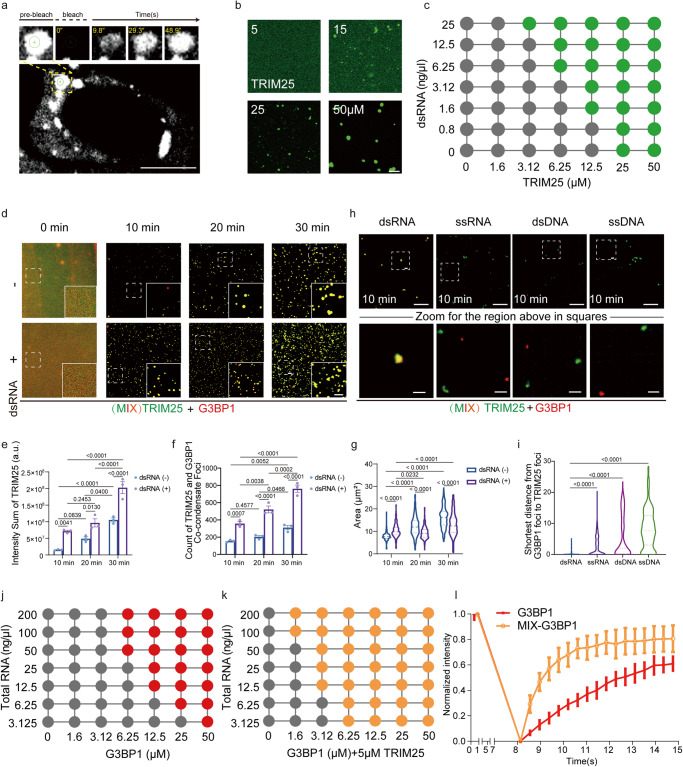
Fig. 2. dsRNA drives co-condensation of TRIM25 and G3BP1.
a FRAP recovery image of GFP-TRIM25 droplets in HEK293T cells upon poly(I:C) stimulation. b Representative fluorescence images of purified TRIM25 at various concentrations. c Summary of in vitro LLPS behavior of purified TRIM25 and a 56-bp dsRNA. Green: LLPS; gray: no LLPS. d–g Time-dependent formation of TRIM25-G3BP1 LLPS in the absence (top) or presence (bottom) of the 56-bp dsRNA (2 ng/μl). Fluorescence microscopy images of 20 μM TRIM25 and 20 μM G3BP1 mixture (d). Sum intensity in (d), dsRNA (−): 10 min vs. 20 min, p value: 6.90e−002; 20 min vs. 30 min, p value: 3.52e−002. dsRNA (−) vs. dsRNA (+): 10 min, p value: 4.12e−003; 20 min, p value: 1.30e−002; 30 min, p value: 3.44e−005 (e). Counts in (d), dsRNA (−): 10 min vs. 20 min, p value: 0.4577; 20 min vs. 30 min, p value: 4.66e−002. dsRNA (−) vs. dsRNA (+): 10 min, p value: 7.46e−004; 20 min, p value: 1.12e−005; 30 min, p value: 2.73e−007. f Areas in (d), dsRNA (−): 10 min vs. 20 min, p value: <0.0001; 20 min vs. 30 min, p value: <0.0001. dsRNA (−) vs. dsRNA (+): 10 min, p value: 6.92e−010; 20 min, p value: 6e−014; 30 min, p value: <0.0001 (g). h, i Only the dsRNA induced the merge of G3BP1 and TRIM25 droplets in 10 min after the addition of nucleic acids (2 ng/μl). h Fluorescence microscopy images of 20 μM TRIM25 and 20 μM G3BP1 mixture. Lower panel: zoomed images. i The shortest distance between G3BP1 and TRIM25 showing significant co-localization of two droplets upon the addition of dsRNA. j, k Summary of the LLPS behaviors of purified recombinant G3BP1 and total RNA, in the presence or absence of TRIM25. Red (j) and yellow (k): LLPS; gray: no LLPS. l Graphic presentation of fluorescence recovery dynamics after photobleaching of areas inside the droplets. All data are representative of at least three independent experiments (a–c, d, h, j–l). Scale bar, 10 µm; Scale bar in Zoom, 2 µm (a, b, d, h). Mean ± s.e.m., statistical analysis was performed using one-way ANOVA (i) or two-way ANOVA (e–g).

