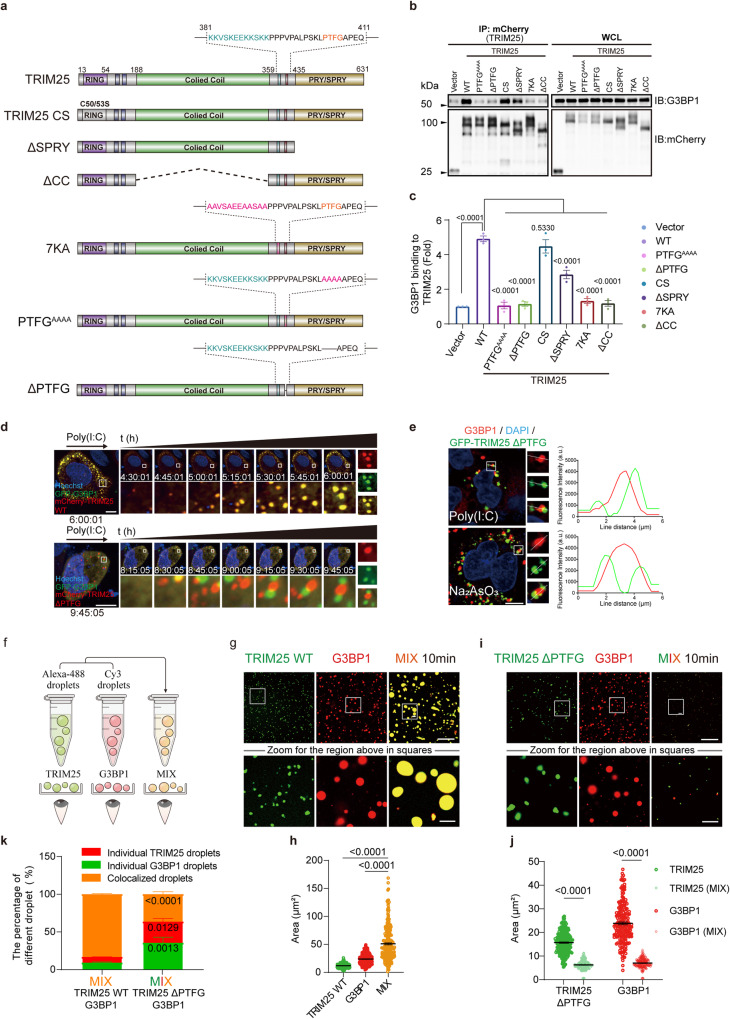
Fig. 3. The direct interaction between TRIM25 and G3BP1 is required for their co-condensation.
a Schematic diagram of full-length (FL) and various truncations/point mutations of TRIM25 used in the experiment. b IP experiments to assess the interaction between TRIM25 and G3BP1. HEK293T cells were transfected with mCherry-TRIM25 FL, the indicated TRIM25 mutants, or empty vector for 24 h. The cell lysates were subjected to immunoprecipitation with mCherry beads followed by immunoblotting with indicated antibodies. c Quantification of immunoblots. d A time-lapse micrograph of G3BP1 (green) and TRIM25 WT or ∆PTFG (red) speck formation after poly(I:C) transfection, and the zoomed images of the speck at 6 or 10 h after transfection. Inset: higher magnification of the white boxed area. e The PTFG motif of TRIM25 is required for co-localization with G3BP1 in HeLa cells. Experiments were performed similar to those in Fig. 1c, except that the cells were transfected with GFP-TRIM25 ∆PTFG, instead of TRIM25 WT. Line scans show the related intensity profiles of TRIM25 and G3BP1. f Experimental workflow for two-color droplet mixing assay. g, h Fluorescence microscopy images of 50 μM TRIM25 droplets, 50 μM G3BP1 droplets, or their mixture (with 50 ng/μl total RNA). Quantitative analyses of droplet areas in (g). For TRIM25, n = 372; G3BP1, n = 201; MIX: TRIM25 + G3BP1, n = 259; n represents the number of droplets (h). i, j Fluorescence microscopy images of 50 μM TRIM25 ∆PTFG droplets, 50 μM G3BP1 droplets, or their mixture. Quantitative analyses of droplet areas in (g). For TRIM25, n = 256; TRIM25 (MIX), n = 192; G3BP1, n = 186; G3BP1 (MIX), n = 179; n represents the number of droplets (j). k Quantitative analyses of the percentage of different droplets after mixing G3BP1 and TRIM25 in (h) and (j). TRIM25 WT + G3BP1 vs. TRIM25 ΔPTFG + G3BP1: TRIM25 droplets, p value: 3.25e−004; G3BP1 droplets, p value: 3.59e−003; colocalized droplets, p value: 1.94e−007. Data are representative of at least three independent experiments (b–e, j, i). Scale bars, 10 μm; Scale bars in Zoom, 2 μm (d, e, j, i). (a.u. arbitrary units.) Mean ± s.e.m., statistical analysis was performed using one-way ANOVA (c, h) or two-way ANOVA (j, k).

