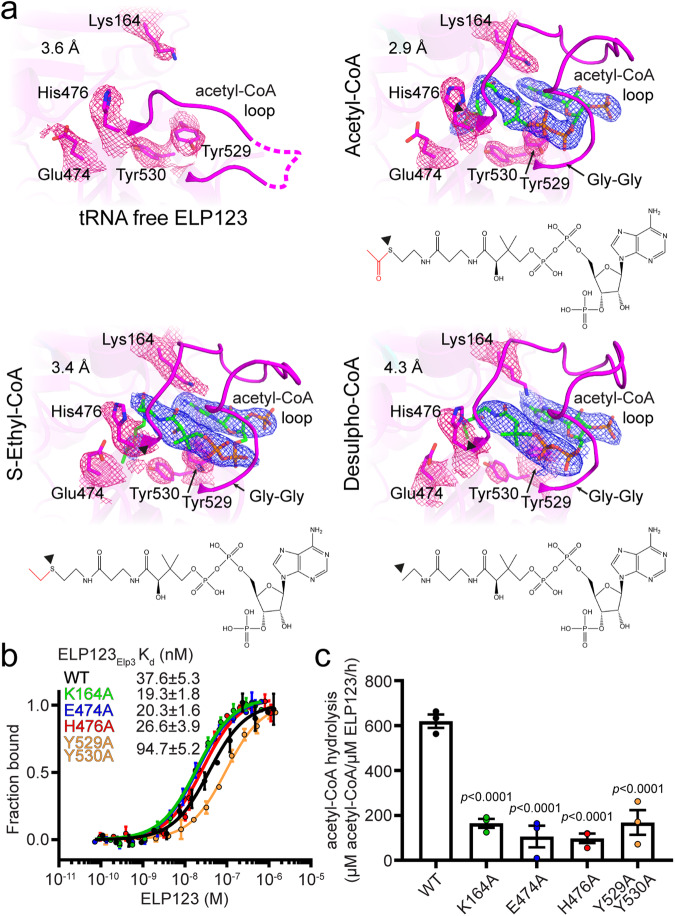
Fig. 2. Structure and biochemical characterizations of conserved acetyl-CoA binding and hydrolysis.
a Close-up view of acetyl-CoA loop in the tRNA-free state of ELP123 compared to ELP123 bound to tRNA in the presence of acetyl-CoA (2.87 Å), ECA (3.35 Å) or DCA (4.25 Å). In all close-ups, residues interacting with acetyl-CoA and their respective densities are highlighted (pink mesh) while the densities of the ligands are shown in blue. b MST measurements with calculated Kd values for ELP123 and ELP3 mutants bound to tRNAGlnUUG. n = 3 (independent experiments). Data are presented as mean values ± SEM. c Acetyl-CoA hydrolysis rates of ELP123 and ELP3 variants in the presence of tRNAGlnUUG, n = 3 (independent experiments). Statistical analysis: one-way ANOVA with Dunnett’s multiple comparisons test. Statistically significant differences are indicated. Data are presented as mean values ± SEM. Source data are provided as a Source Data file.

