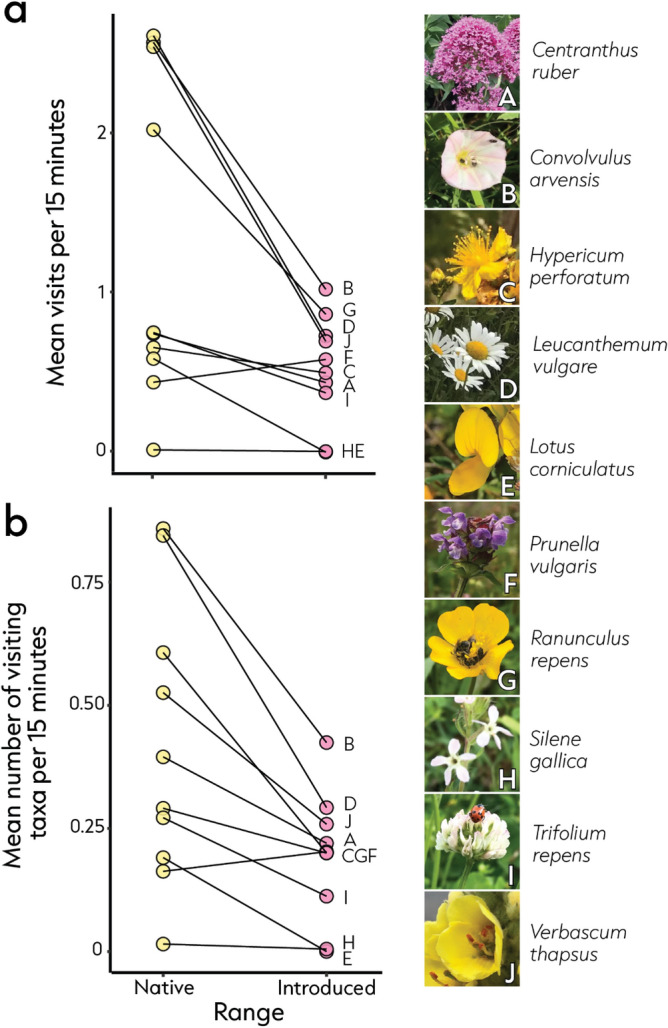
Figure 3.

Comparison of (a) the mean number of flower visits and (b) mean number of visiting taxa per 15-min observation for each species in the native (yellow) and introduced (pink) ranges. To calculate this metric, visits were first divided by the number of floral units per observation before taking means (per species per site) [see Supplementary information for variance across sites and model coefficients/confidence intervals per species]. Images of plant species observed in this study are displayed to the right of both graphs accompanied by letters A-J which correspond to letters displayed on the graphs (all images credited to Z Xirocostas).
