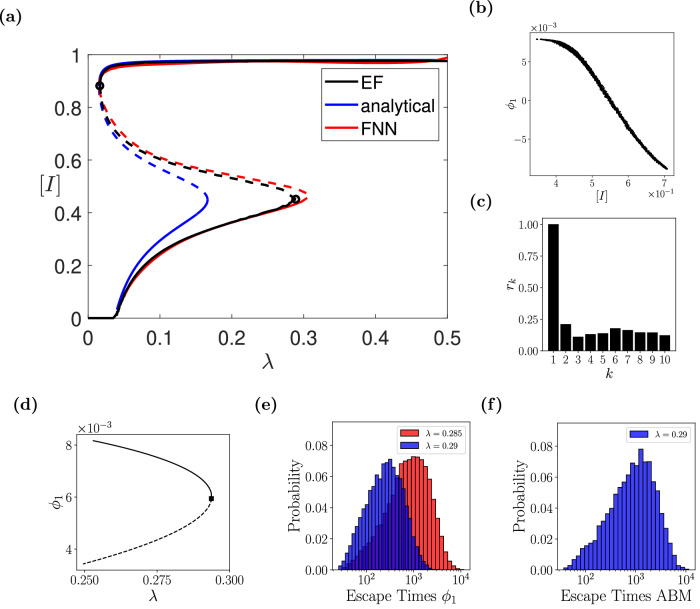
Fig. 3. Numerical results for the epidemic ABM.
a Reconstructed bifurcation diagram w.r.t. the probability of infection, λ, with the ML mean-field surrogate model; the one computed from the analytical mean-field Eq. (8), and the one constructed with the Equation-free (EF) approach are also given59. Dashed lines represent the unstable branches. b, c ABM-based simulations- and Diffusion Maps- (DMAPs) driven observables. b The density of infected [I] vs. the first DMAPs coordinate ϕ1. c The estimated residual rk based on the local linear regression algorithm70. d The effective bifurcation diagram based on the drift component of the identified mean-field macrosocpic SDE based on ϕ1. e, f Histograms of escape times obtained with simulations of 10,000 stochastic trajectories using: e the constructed SDE for λ = 0.29 (blue histogram), λ = 0.285 (red histogram), and f the full ABM at λ = 0.29.

