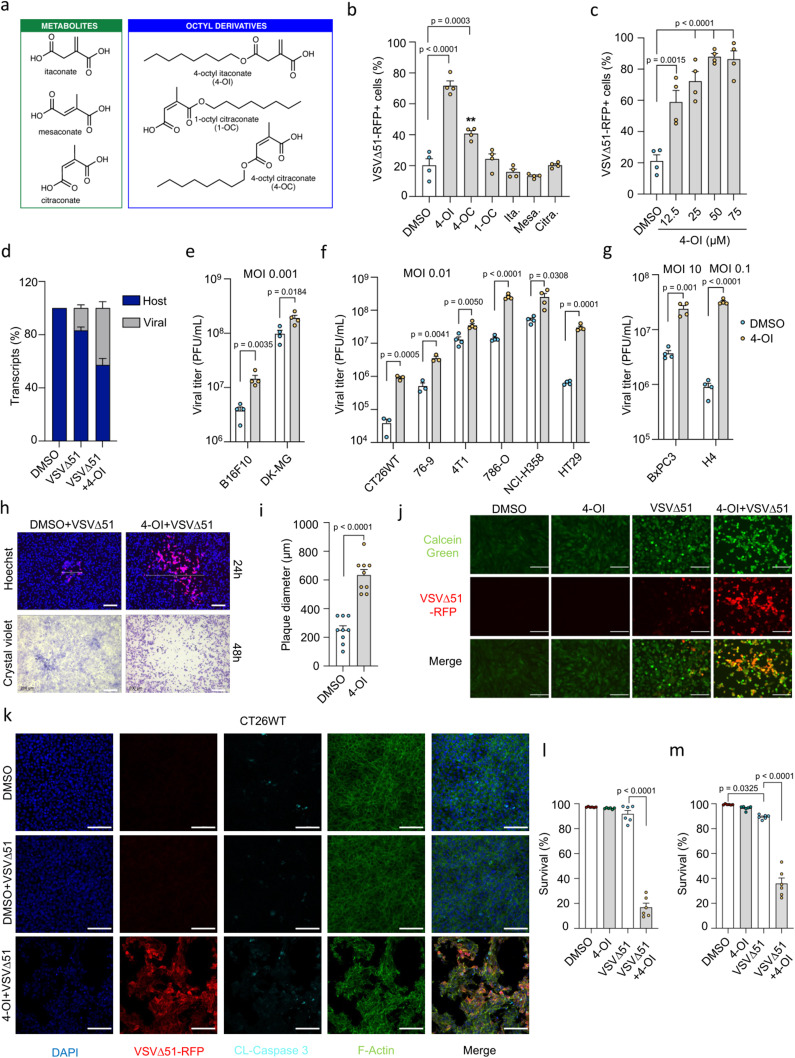
Fig. 1. 4-OI promotes VSVΔ51 infection and oncolysis.
a Structures of itaconate, isomers and octyl-derivatives b 786-O cells pretreated with octyl-derivatives (80 μM) or metabolites (25 mM) for 24 h, then infected with VSVΔ51 (MOI of 0.01). Virus-infected cells quantified by flow cytometry at 17 h post-infection. c Flow cytometry analysis of virus-infected cells in 786-O cells treated with increasing 4-OI concentrations at 17 h post-infection. d Host vs viral RNA ratio in VSVΔ51-infected 786-O cells (MOI of 0.01) with or without 4-OI (75 μM). e–g Cancer lines pretreated with 4-OI (125 μM or 75 μM for 786-O cells) for 24 h, then infected with VSVΔ51 at varying MOIs. Viral titers determined from supernatants 24 h post-infection. h 786-O cells pretreated with 4-OI (75 μM) for 24 h and infected with VSVΔ51 (MOI of 0.0001), followed by plaque imaging. Scale bars, 200 μm. i Plaque diameters measured 24 h after infection. j 786-O cellular layer integrity assessed by Calcein green staining after treatment with 4-OI (75 μM) and VSVΔ51 infection (MOI 0.01) for 24 h. Scale bars, 100 μm. k CT26WT cells treated with 4-OI (125 μM) for 24 h post-infection with VSVΔ51 (MOI 0.01) for 48 h. Cleaved caspase 3 in cyan blue, nuclei in dark blue stained with DAPI, and actin filaments with phalloidin in green. Scale bars, 100 μm. l, m CT26WT and 786-O cells pretreated with 4-OI (125 μM) and (75 μM), respectively, for 24 h, then infected with VSVΔ51 at a MOI of 0.01. Percentage of viable cells determined by flow cytometry at 30 h post-infection. Data are means ± SEM of two independent experiments in duplicates in (b, c, e–g) (except for CT26WT and 76-9, from one experiment in triplicates); one experiment in triplicates for (d); one experiment in multiple replicates for (I); and two experiments in triplicates for (l, m). Images are from one experiment in (h), one representative experiment out of two in (j), and one out of two in (k). Statistical significance indicated by one-way ANOVA for (b, c, l, m); and two-tailed Student’s t-test for (e–g, i). Source data provided in a Source Data file.

