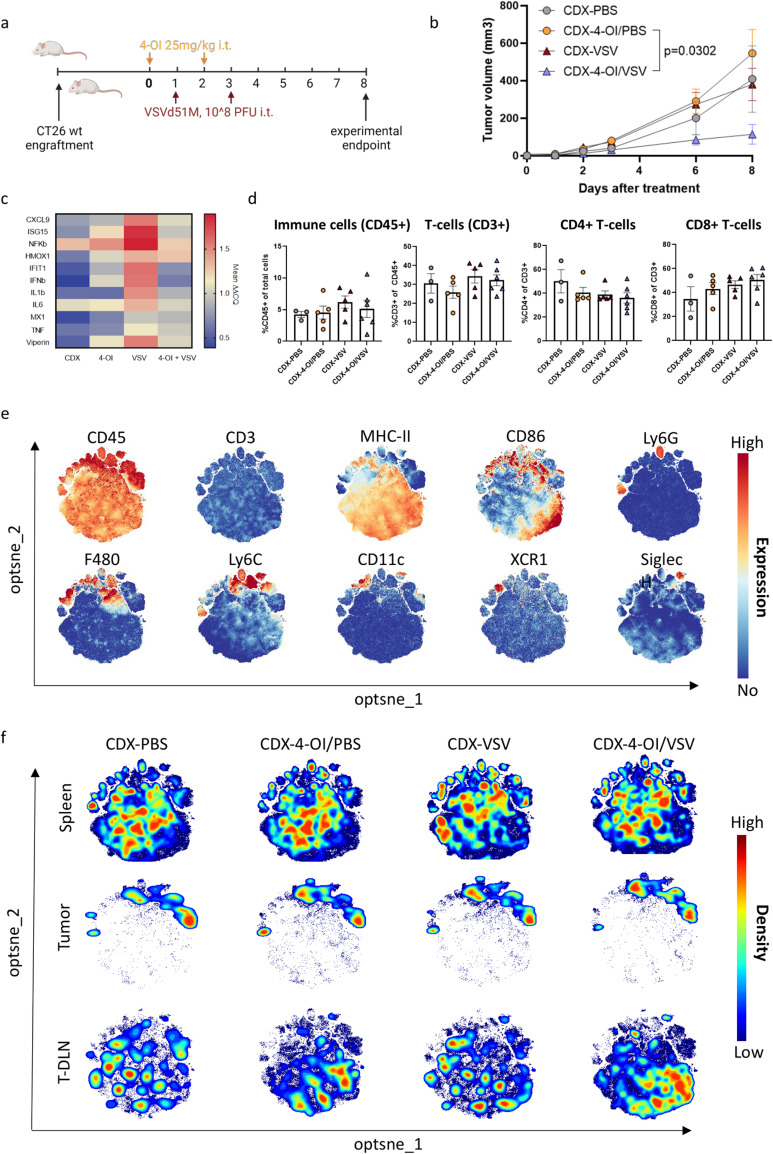
Fig. 6. 4-OI dampens innate antiviral immunity in vivo but does not affect the distribution of immune cells in the tumor.
a BALB/c mice were injected subcutaneously with 1 × 10⁵ CT26WT tumor cells. Treatment via intratumoral (i.t.) injections with vehicle (40% CDX) in PBS or with 4-OI (25 mg/kg/dose) in 40% CDX in PBS for 24 h prior challenge with VSVΔ51 expressing firefly luciferase (108 PFU) was given as indicated by arrows. Mice were euthanized seven days after the first VSVΔ51 injection for analysis. b Mean ( ± SEM) tumor growth of the groups followed the start of the treatment regimen (n = 3 in the CDX-PBS group; n = 5 in the CDX-4-OI/PBS group, n = 6 in CDX-VSV and CDX-4-OI/VSV groups). Statistics on tumor volumes at day 8 indicate significance by one-way ANOVA followed by Šídák’s multiple comparisons test on tumor sizes at day 8. c Relative expression analyzed by RT-qPCR of RNA isolated from bulk tumor samples. n = 3 in the CDX-PBS group; n = 5 in the CDX-4-OI/PBS group, n = 6 in CDX-VSV and n = 4 CDX-4-OI/VSV groups (two samples excluded due to insufficient tumor material) d Flow cytometry data indicating the distribution of main T-cell populations within tumors upon different treatments analyzed by manual gating in FlowJo software. Mean ± SEM is displayed and compared per treatment group. Each data point represents one animal. n = 3 in the CDX-PBS group; n = 5 in the CDX-4-OI/PBS group, n = 5 in CDX-VSV (one sample lost during acquisition), and n = 6 CDX-4-OI/VSV groups. e Expression intensity profile of myeloid markers on clustered live, CD45+, CD3− cells from merged samples (n = 60, 3 different organs) to distinguish the regional expression of single myeloid markers. Relative expression is indicated by color where red indicates high expression and blue represents no expression within the cluster. f Opt-SNE cluster plots of live, CD45+, CD3− cells from indicated organs and treatment group (n = 3 in the CDX-PBS group; n = 5 in the CDX-4-OI/PBS group, n = 6 in CDX-VSV and CDX-4-OI/VSV groups). Cell density is indicated by color where red indicates high density and blue indicates low density within the cluster. Analysis generated using OMIQ software. (a) was created using BioRender.com. Source data are provided as a Source Data file.

