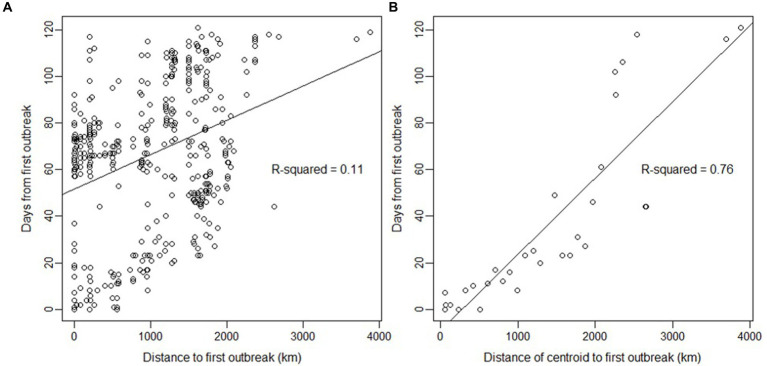
Figure 3.
Relationship between days and distance since the first outbreak of highly pathogenic avian influenza H5N1 in wild birds in Chile. (A) Relationship using the coordinates of each outbreak (n = 445). The lines are predictions from the linear model (R-squared is given for the prediction). (B) Same analysis but using the distance from centroids and the date of the first case detected on the centroid (n = 31), with a slope of 32.76 days/1000 km. Centroids were estimated using a cell size grid = 1 with the st_make_grid function of the sf package in R. The northernmost outbreak of the first day of reporting in the dataset was used as the first index case for all calculations.

