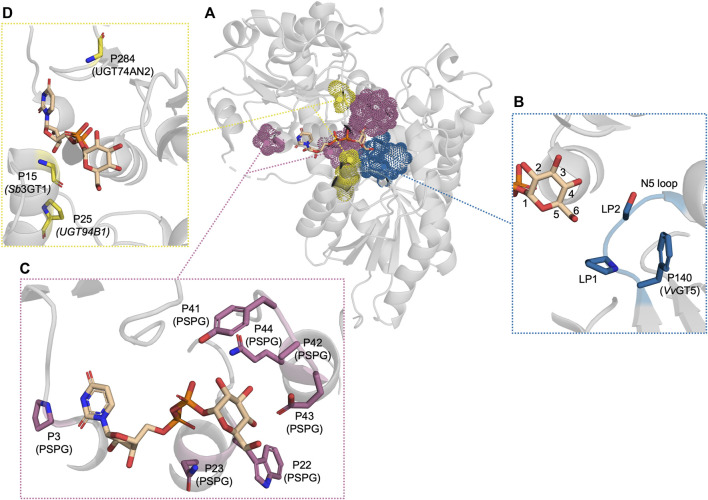
FIGURE 3.
The residues which have been reported to be important for UDP-sugar donor specificity, displayed in PDB: 6SU6. (A) An overview of the residues displayed as dot spheres representing the van der Waals surface area. Each color corresponds to a specific area: blue indicates the N5 loop, magenta indicates the PSPG motif, and yellow indicates residues near the cavity entrance. (B) A close-up view of the N5 loop area. (C) A close-up view of the PSPG motif area. (D) A close-up view of the residues close to the cavity entrance. “P” refers to the position in the corresponding UGT or PSPG motif mentioned in parentheses.

