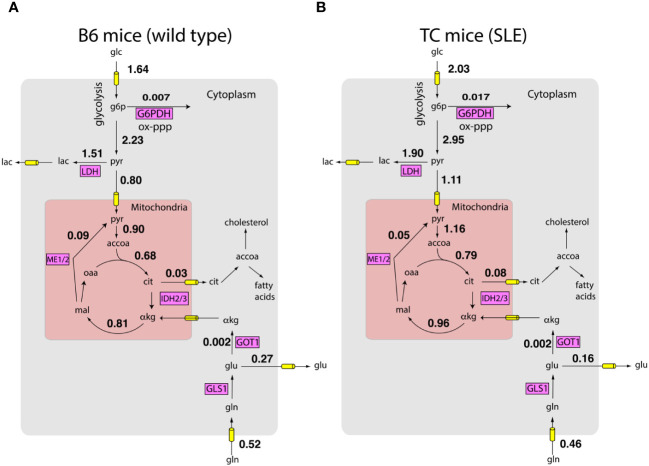
Figure 2.
Inferred metabolic activity HC and SLE T cells. Inferred intracellular metabolic fluxes in in vitro stimulated CD4+ T cells from HC (A) and SLE (B) mice. Shown are key metabolic reactions in glycolysis, TCA cycle, and oxidative pentose phosphate pathway. Key enzymes in these pathways are shown in magenta boxes. Numbers represent model estimated reaction rates in millimoles per gram dry cell weight per hour (mmol/g-DW-hr). The fluxes are reported as an average of measurements on T cells harvested from n = 4 mice for each condition.

