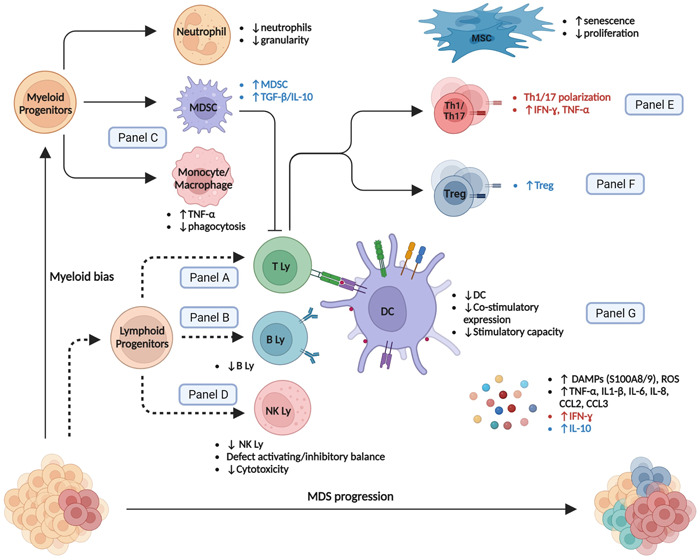
Figure 2.

Immune and bone marrow environment changes during the MDS course. Main alterations in low‐risk, high‐risk, or all MDS patients are specified in red, blue, and black, respectively. DC, dendritic cell; IL, interleukin; Ly, lymphocyte; MDS, myelodysplastic neoplasms; MDSC, myeloid‐derived suppressor cell; MSC, mesenchymal stromal cell; NK, natural killer; Th, Helper CD4+ T cell; Treg, regulatory T cell. Dashed lines represent impaired differentiation.
