FIGURE 2.
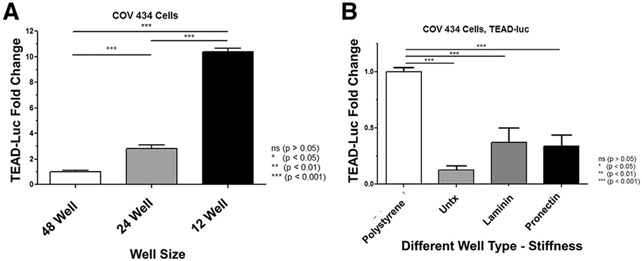
Changes in mechanotransduction. (A) The well size increased Tea domain family (TEAD) activity. The same number of cells was placed into each well size, and additional medium was added in the 24-and 12-well plates to meet fluid volume requirements; thus, the lower the well plate number, the greater the well size, and the lower the cell density. The x-axis indicates increasing well size (48 wells, 200 μL/well; 24 wells, 500 μL/well; and 12 wells, 1,000 μL/well), and the y-axis shows TEAD-luciferase in RLU fold change. Increasing well size from 48-to 24-well plates, 24-to 12-well plates, and 48- to 12-well plates and decreased cell density resulted in an increase in normalized TEAD-luc activity. COV434 cells demonstrated a 2.8-fold (P<.001), 3.7-fold (P<.001), and 10.4-fold (P<.001) higher TEAD-luc activity, respectively. Samples were analyzed by n = 12 (48-well plate), 10 (24-well plate), and 9 (12-well plate) (2 biologic replicates). Error bars = standard error of the mean. Statistical analysis was performed using the Kruskal-Wallis test, followed by a post hoc Mann-Whitney U test. *P <.05, **P <.01, and ***P<.001. (B) Differences in TEAD-luc expression of granulosa cells when grown on plates with different stiffness and composition. To evaluate changes in mechanotransduction signaling, 4 different types of plates were compared. Polystyrene is the typical well type that is the stiffest with a rigidity of 2–4 GPa. Three types of Flexcell plates that were less stiff with a rigidity of 930 KPa with 3 different coatings were used: untreated, laminin, and ProNectin. The x-axis indicates different well types, and the y-axis shows TEAD-luciferase in RLU fold change. There was a significant decrease in TEAD-luc activity between the polystyrene plate and all 3 silicone Flexcell plates (P <.0001), meaning that there was greater reporter activity in cells plated on a stiffer matrix. There was no significant difference in TEAD-luc expression between untreated Flexcell plates and laminin- or ProNectin-coated plates (P =.24 and P =.13, respectively). Samples were analyzed with 2 biologic replicates and 3 technical replicates each. Error bars = standard error of the mean. Statistical analysis was performed using the Kruskal-Wallis test, followed by a post hoc Mann-Whitney U test. *P <.05, *P<.01, and ***P<.001. RLU = relative luciferase unit; TEAD = Tea domain family; TEAD-luc = TEAD luciferase.

