
Figure 1.
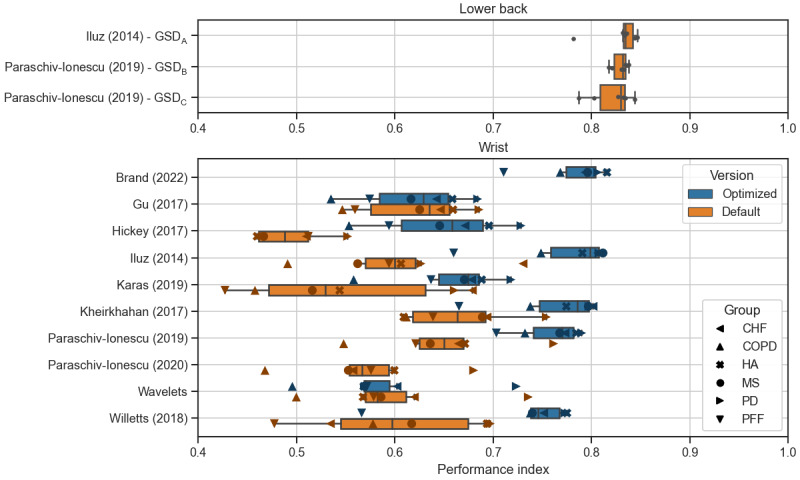
Performance of assessed algorithms based on a disease group level (n=6). Individual data points are highlighted for each disease group as an overlay. The names of lower back algorithms are given as defined previously [11] and referred to in Table 1. Boxes indicate lower and upper quartiles; the whiskers correspond to 1.5 IQR. Colors indicate the algorithm version: orange indicates the default algorithm version without optimized parameters, and blue indicates the optimized algorithm (parameter tuning based on the optimization data set). In the “wrist” subplot, shapes indicate the disease group to visualize algorithm performance for each group. CHF: congestive heart failure; COPD: chronic obstructive pulmonary disease; GSD: gait sequence detection; HA: healthy older adults; MS: multiple sclerosis; PD: Parkinson disease; PFF: proximal femoral fracture (hip fracture recovery).