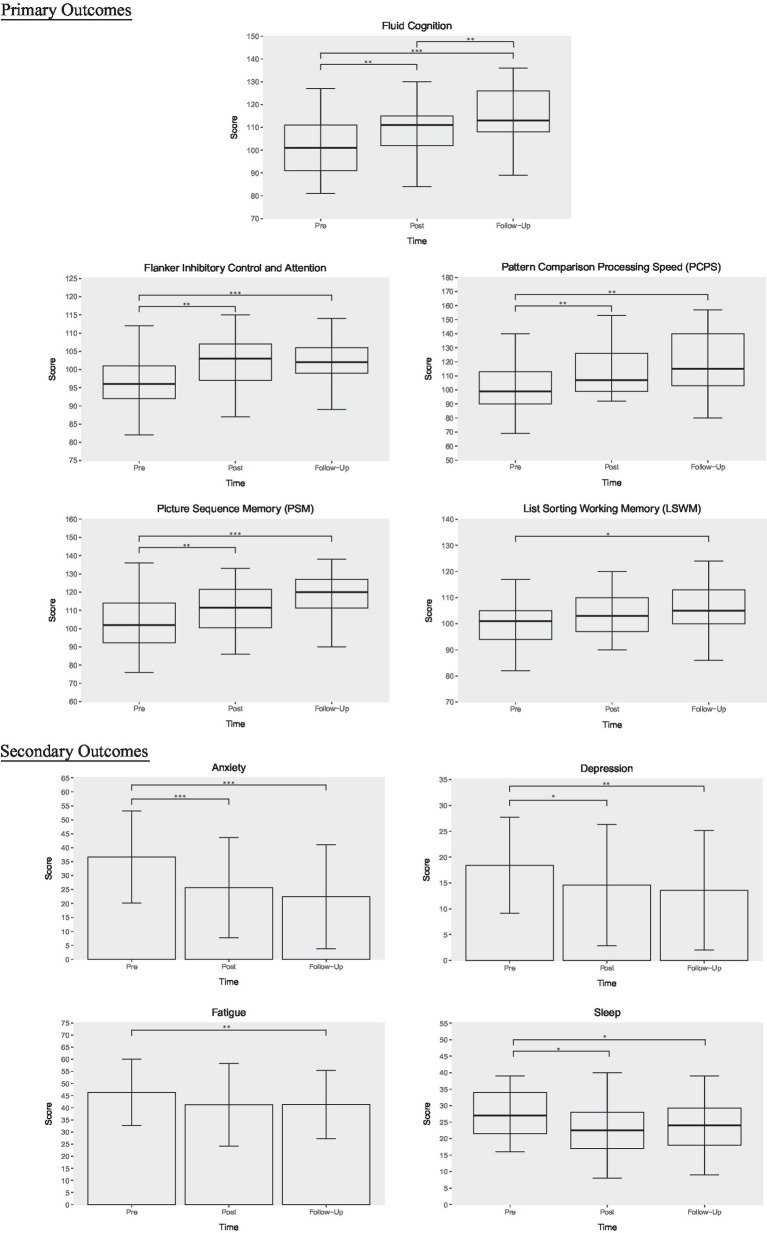
Figure 3.
T-VNS intervention outcomes. This figure illustrates changes in cognition, anxiety, depression, fatigue, and sleep across three timepoints: pre-intervention, post-intervention, and 1-month follow-up. Boxplots are used for primarily nonparametric data, whereas column graphs depict parametric data. Error bars reflect standard error. *p < 0.05, **p < 0.01, ***p < 0.001.

