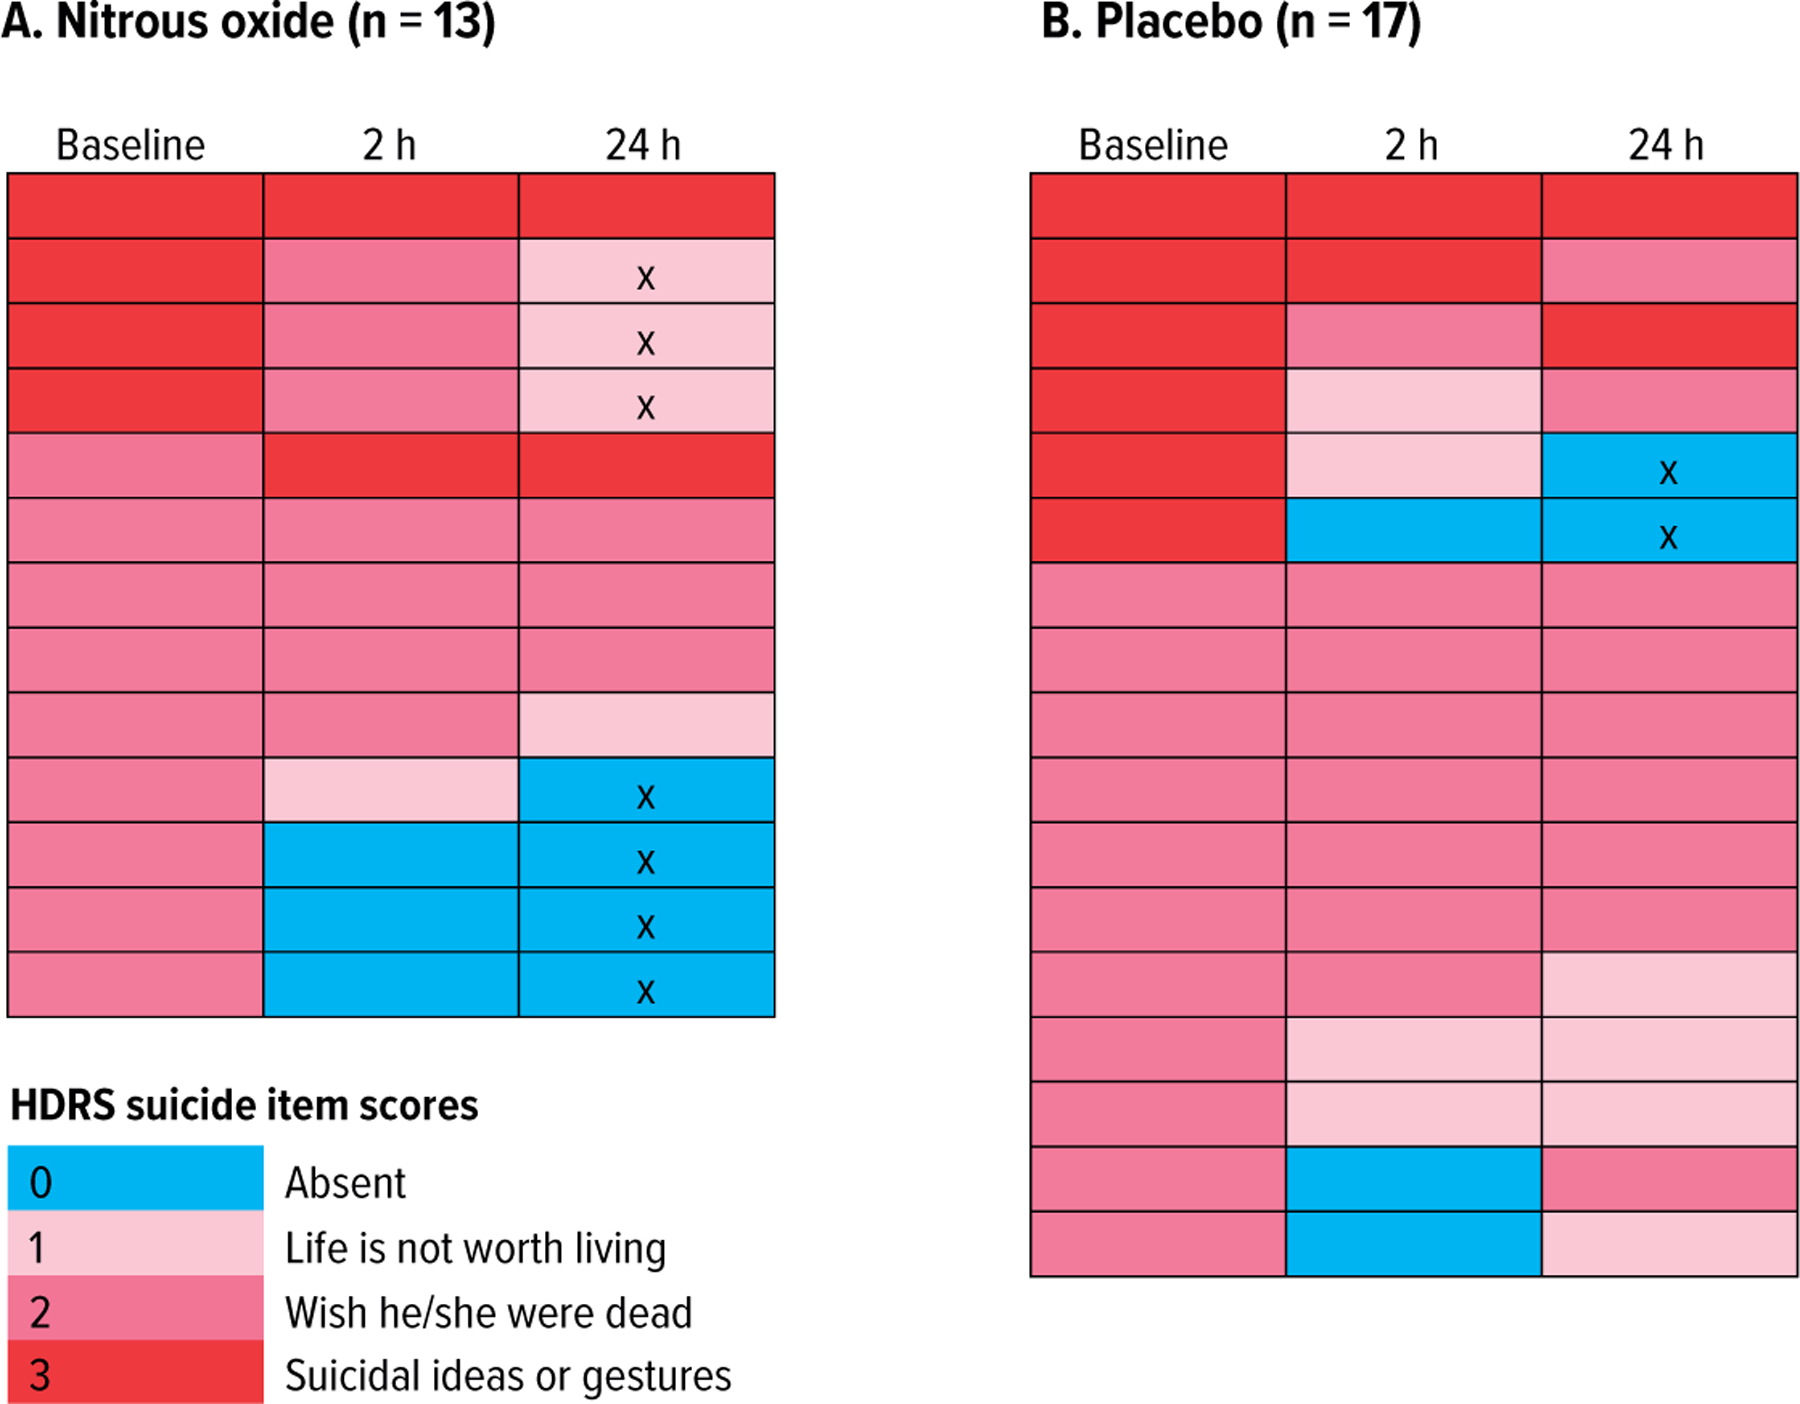
Figure 1. Cell Plot (Heat Map) of Individual Responses to (A) Nitrous Oxide vs (B) Placebo as Measured on the Hamilton Depression Rating Scale (HDRS) Suicide Item (Item 3)a.

aColor indicates severity of suicidal thinking (see figure key). Time points used were prior to inhalation, to establish a baseline, and 2 hours and 24 hours following inhalation. Each row represents a subject. An “x” indicates subjects that had a meaningful reduction in suicidal thinking.
