Figure 1.
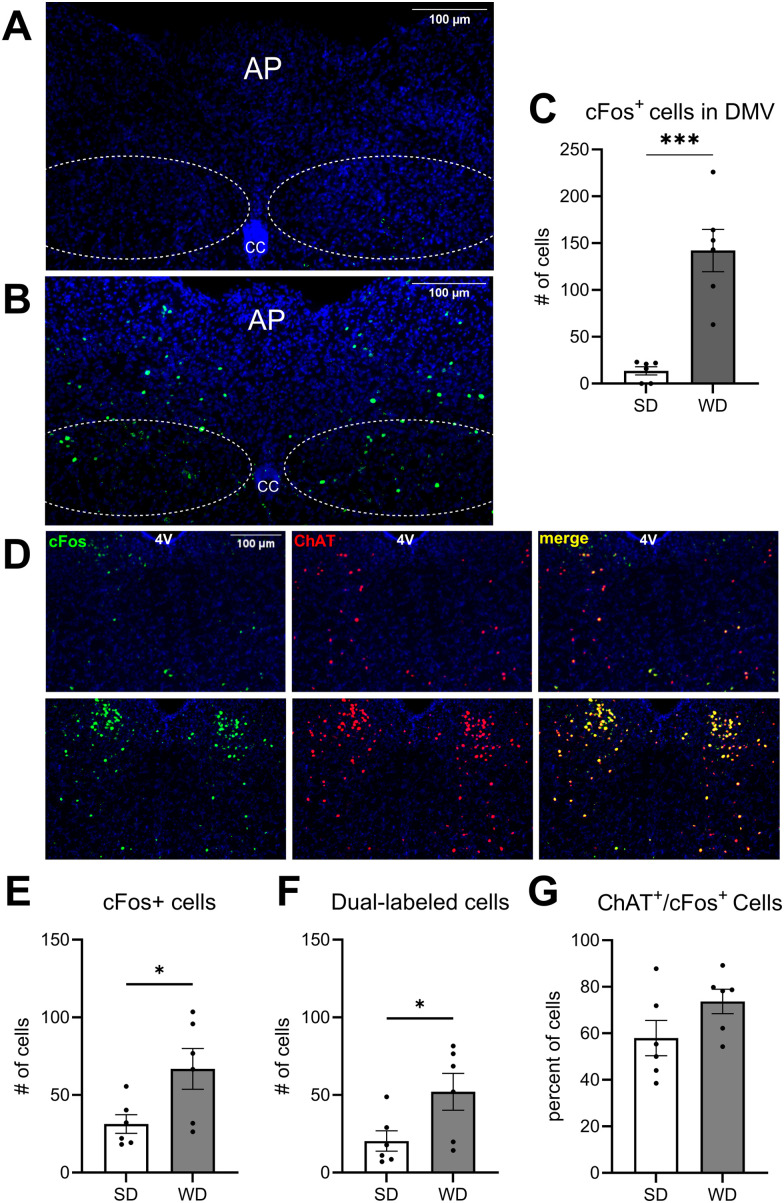
Increased cFos immunoreactivity in the DMV of DIO mice. cFos immunoreactivity was quantified in the DMV of mice fed, A, standard diet (SD) and mice fed, B, Western diet (WD) 45–75 min following the onset of the dark period. C, The number of cFos+ cells was significantly increased in WD mice when compared to SD mice (t(10) = 5.575; p = 0.0002; unpaired Student's t test). D, cFos immunoreactivity (panel 1), ChAT immunoreactivity (Panel 2), and merged (Panel 3) images of the DMV in SD mice (top row) and WD mice (bottom row). E, The number of cFos+ cells was significantly increased in the second cohort of WD mice compared to SD controls (t(10) = 2.462; p = 0.0335; unpaired Student's t test). F, The number of cells colabeled with both cFos and ChAT was significantly increased in the DMV of WD-fed mice (t(10) = 2.342; p = 0.0412; unpaired Student's t test). G, 73.33% of cFos+ cells in WD-fed animals were also immunoreactive for ChAT, while 57.93% of cFos+ cells in SD-fed animals were immunoreactive for ChAT. There was no significant difference in the ratio of ChAT+/cFos+ cells between WD- and SD-fed groups. All data are presented as mean ± SEM, n = 6 mice per diet, ***p < 0.001. AP, area postrema; CC, central canal; 4V, fourth ventricle.

