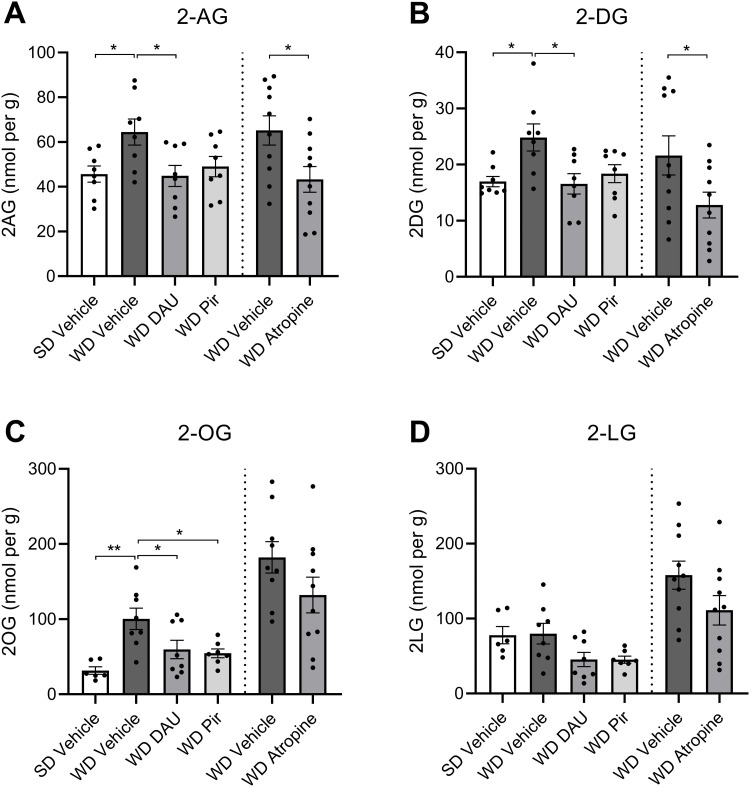
Figure 3.
mAChR antagonists block MAG formation in the jejunum epithelium of DIO mice. Mice fed with standard diet (SD) or Western diet (WD) were treated with a single IP injection of vehicle, DAU5884 (2 mg/kg) or PIR (2 mg/kg) 30 min prior to tissue harvest (cohort 1). A second group (cohort 2) of WD mice was treated with vehicle or ATR (2 mg/kg), and otherwise processed identically to cohort 1. A, 2-AG and other MAGs in upper SI epithelium tissue were isolated via lipid extraction and quantitated using UPLC-MS/MS. 2-AG was significantly elevated in vehicle-treated WD mice when compared to vehicle-treated SD mice. Treatment with DAU or ATR in WD mice restored levels of 2-AG to levels in SD control mice (cohort 1, F(3,28) = 3.721, p = 0.0227; SD vehicle vs WD vehicle p = 0.0448; WD vehicle vs WD DAU p = 0.0402; one-way ANOVA followed by Holm–Sidak's multiple-comparisons test; cohort 2, t(18) = 2.510; p = 0.0218; unpaired Student's t test). B, 2-DG was significantly elevated in vehicle-treated WD mice compared to vehicle-treated SD mice. Treatment with DAU or ATR in WD mice restored levels of 2-AG to that of SD mice (cohort 1, F(3,28) = 4.691, p = 0.0089; SD vehicle vs WD vehicle p = 0.0200; WD vehicle vs WD DAU p = 0.0159; one-way ANOVA followed by Holm–Sidak's multiple-comparisons test; cohort 2, t(18) = 2.115; p = 0.0486; unpaired Student's t test). C, 2-OG was significantly elevated in vehicle-treated WD mice when compared to vehicle-treated SD mice. Treatment with DAU or PIR restored levels of 2-AG in WD mice to those in SD mice (cohort 1, F(3,25) = 6.657, p = 0.0019; SD vehicle vs WD vehicle p = 0.0014; WD vehicle vs WD DAU p = 0.0439; WD vehicle vs WD PIR p = 0.0315; one-way ANOVA followed by Holm–Sidak's multiple-comparisons test; cohort 2, t(17) = 1.565; p = 0.1361; unpaired Student's t test). D, 2-LG levels were not significantly different between any treatment or diet groups (cohort 1, F(3,25) = 3.346, p = 0.0351; SD vehicle vs WD vehicle p = 0.0014; WD vehicle vs WD DAU p = 0.0439; WD vehicle vs WD PIR p = 0.0315; one-way ANOVA followed by Holm–Sidak's multiple-comparisons test; cohort 2, t(18) = 1.720; p = 0.1026; unpaired Student's t test). All data are presented as mean ± SEM, n = 8–10 per group; *p < 0.05, **p < 0.01.

