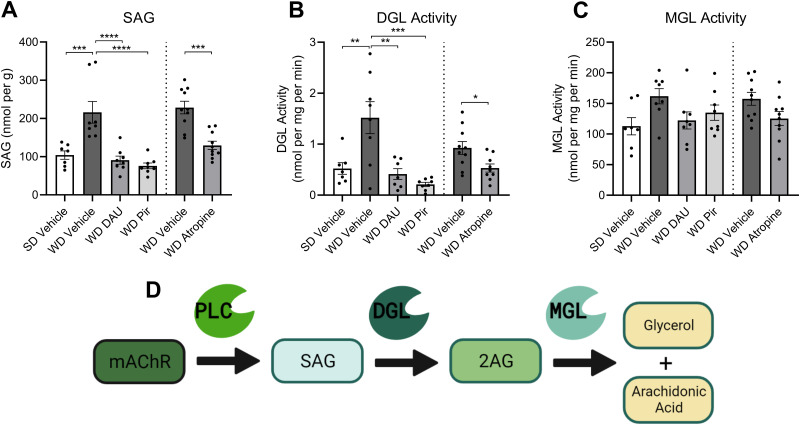
Figure 5.
SAG formation and DGL Activity in upper intestinal epithelium are inhibited by mAChR antagonism in DIO mice. Levels of SAG in the upper SI epithelium tissue were isolated and quantitated using UPLC-MS/MS. The same tissue was analyzed for DGL and MGL activity using an enzymatic assay; enzyme reaction products were isolated and quantitated via UPLC-MS/MS. Enzyme activity was calculated using the nmols of reaction product generated per mg of tissue per minute of the reaction. A, SAG was significantly elevated in vehicle-treated mice fed with Western diet (WD) compared to vehicle-treated mice fed with standard diet (SD). Treatment with DAU, PIR, or ATR in WD mice restored levels of SAG to that of lean controls (cohort 1, F(3,27) = 14.76, p < 0.0001; SD Veh vs WD Veh p = 0.0004; WD Veh vs WD DAU p < 0.0001; WD Veh vs WD PIR p < 0.0001; one-way ANOVA followed by Holm–Sidak's multiple-comparisons test; cohort 2, t(18) = 5.010; p = 0 < 0.0001; unpaired Student's t test). B, DGL activity was significantly elevated in vehicle-treated WD mice compared to vehicle-treated SD mice. Treatment with DAU, PIR, or ATR in WD mice restored DGL activity to that of lean controls (cohort 1, F(3,26) = 10.57, p = 0.0001; SD Veh vs WD Veh p = 0.0030; WD Veh vs WD DAU p = 0.0013; WD Veh vs WD PIR p = 0.0001; one-way ANOVA followed by Holm–Sidak's multiple-comparisons test; cohort 2, t(17) = 2.546; p = 0.0209; unpaired Student's t test). C, MGL activity was not different between any diet or treatment group (cohort 1, F(3,27) = 2.537, p = 0.0777; one-way ANOVA; cohort 2, t(18) = 2.081; p = 0.0520; unpaired Student's t test). All data are presented as mean ± SEM, n = 8–10 per group; *p < 0.05, **p < 0.01, ***p < 0.001, ****p < 0.0001. D, Schematic illustrating that activation of Gq-coupled mAChRs initiates the PLC-dependent generation of SAG, which is subsequently converted to 2-AG by DGL. 2-AG is further hydrolyzed by MGL into glycerol and arachidonic acid. Illustration created with BioRender.com.

