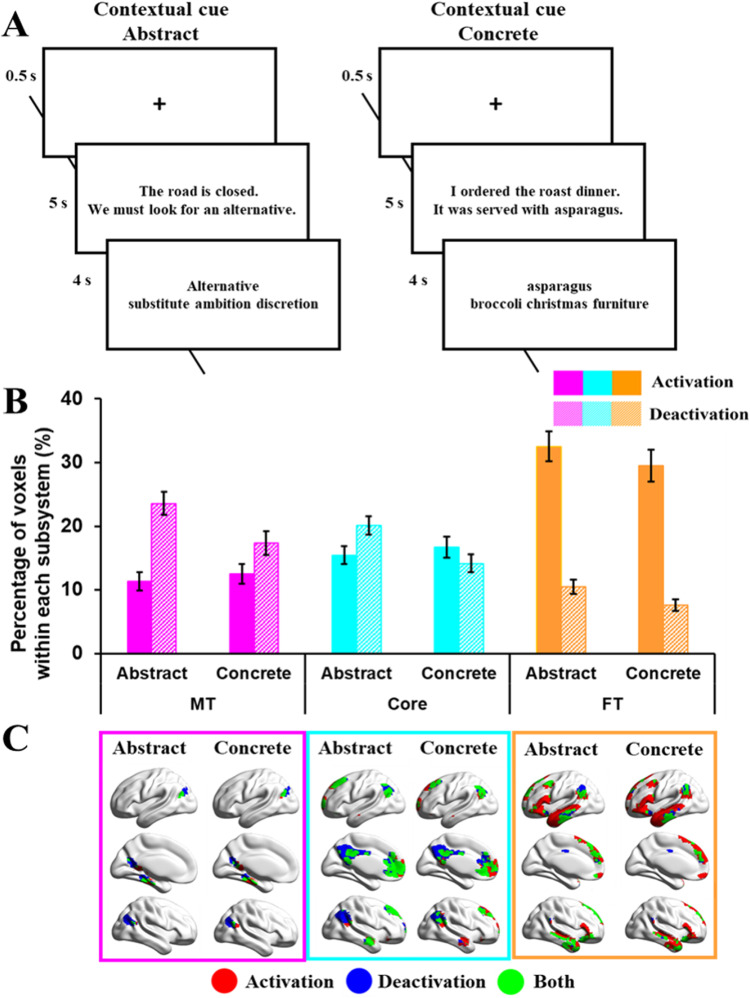
Figure 3.
A, Example of task procedures of abstract or concrete tasks (Study 3). B, Percentage of activating or deactivating voxels in abstract or concrete tasks. The three colors represent the percentage of voxels extracted from three subsystems (pink, medial temporal regions; cyan, core regions; orange, frontotemporal regions). Solid bars represent the percentages of activating voxels, and grid bars represent the percentage of deactivating voxels. Error bars represent one standard error. C, Regions of activating voxels (in red color), deactivating voxels (in blue color), and the overlapping regions of both activating and deactivating voxels (i.e., regions showed activation in several participants, and deactivation in another group of participants, in green color).

