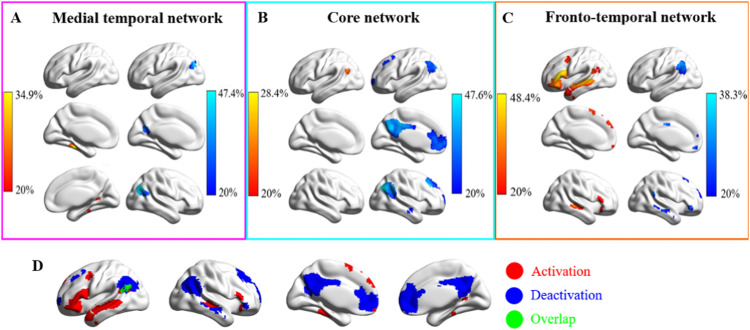
Figure 5.
A–C, Regions that commonly activated or deactivated in the three subsystems across the four task-fMRI datasets. A–C, Regions commonly activated or deactivated in MT, core, and FT subsystems, respectively. The values in the activation or deactivation maps represent the percentage of participants that activated or deactivated in the three subsystems (red, activation; blue, deactivation; green, overlap regions). D, Activated and deactivated regions within the whole DMN (binarized from the maps from A–C).

