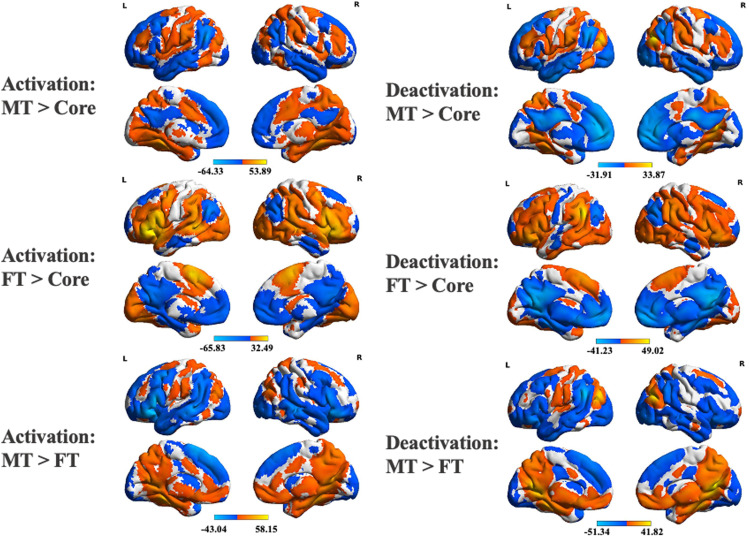
Figure 6.
Contrasts between functional connectivity maps seeding from commonly activated regions in the three subsystems. Each contrast map was FWE-corrected to the voxel-level p < 0.001 and cluster-level p < 0.05. A–C, Contrasts of MT versus Core, FT versus Core, and MT versus FT, respectively. The left and right panels correspond to the maps for activation and deactivation seeds, respectively.

