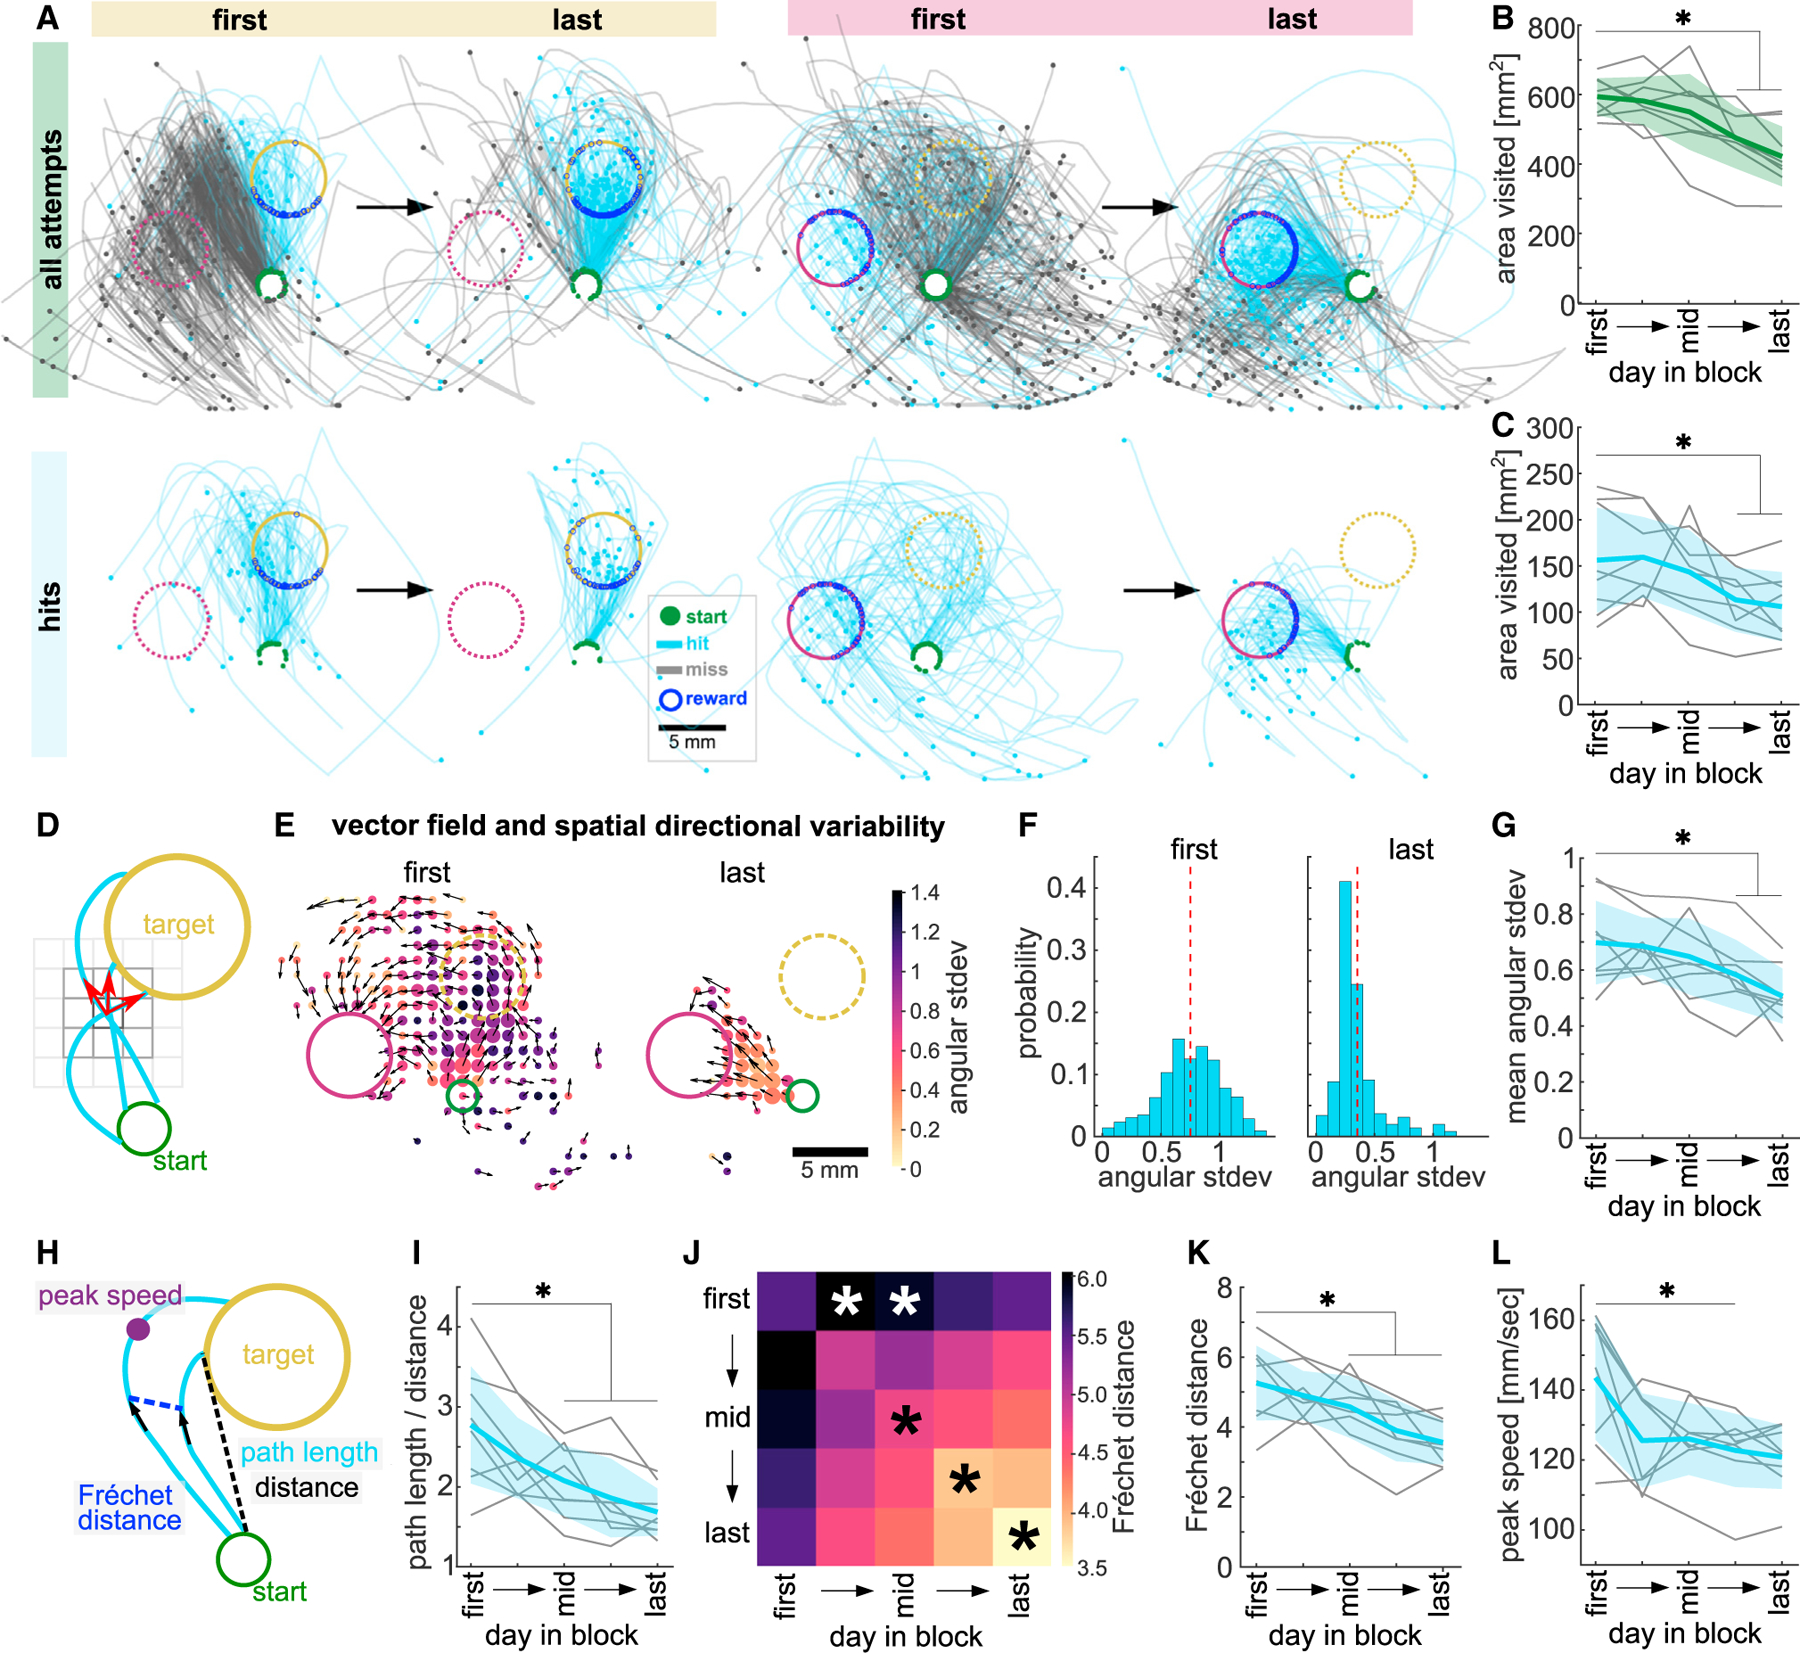
Figure 2. Mice explore the workspace with high spatial directional variability and tortuous trajectories.

(A) Example miss (gray) and hit (blue) trajectories of first and last days of a target 1 and target 2 block. Top: all attempts. Bottom: 50 subsampled hit trajectories.
(B) Total area explored by all full-length trajectories.
(C) Total area explored by 50 subsampled hit trajectories before target entry.
(D) Schematic of vector field and spatial directional variability.
(E) Example vector fields showing mean vector of all trajectories in a spatial bin (black arrows) and heatmap of directional variability in that bin on first and last day of a target 2 block. Dot size represents number of visits/bin.
(F) Same data as (E), histogram of directional variability weighted by number of visits/bin (dashed line, mean across bins).
(G) Mean spatial directional variability.
(H) Schematics of path length and Euclidean distance from start to target (tortuosity, path length/distance), pairwise Fréchet distance (FD), and peak speed.
(I) Average tortuosity of hits.
(J) Average FD between hit trajectories within and across sessions. Similarity within later sessions is bigger than within the first session (diagonal, black asterisks). Hits in early and middle sessions are dissimilar to those in the first session (top row, white asterisks).
(K) Same as diagonal in (J) showing all animals.
(L) Average peak speed of hits. Data from 5 selected days per block, averaged across all blocks. Green, all full-length trajectories; blue, hit trajectories from start to target entry. One-way ANOVA with repeated measures, Dunnett’s multiple comparisons between the first day and all other days, *p < 0.05. Mean ± SD and single animals (n = 8). See also Figure S2 and Table S2.
