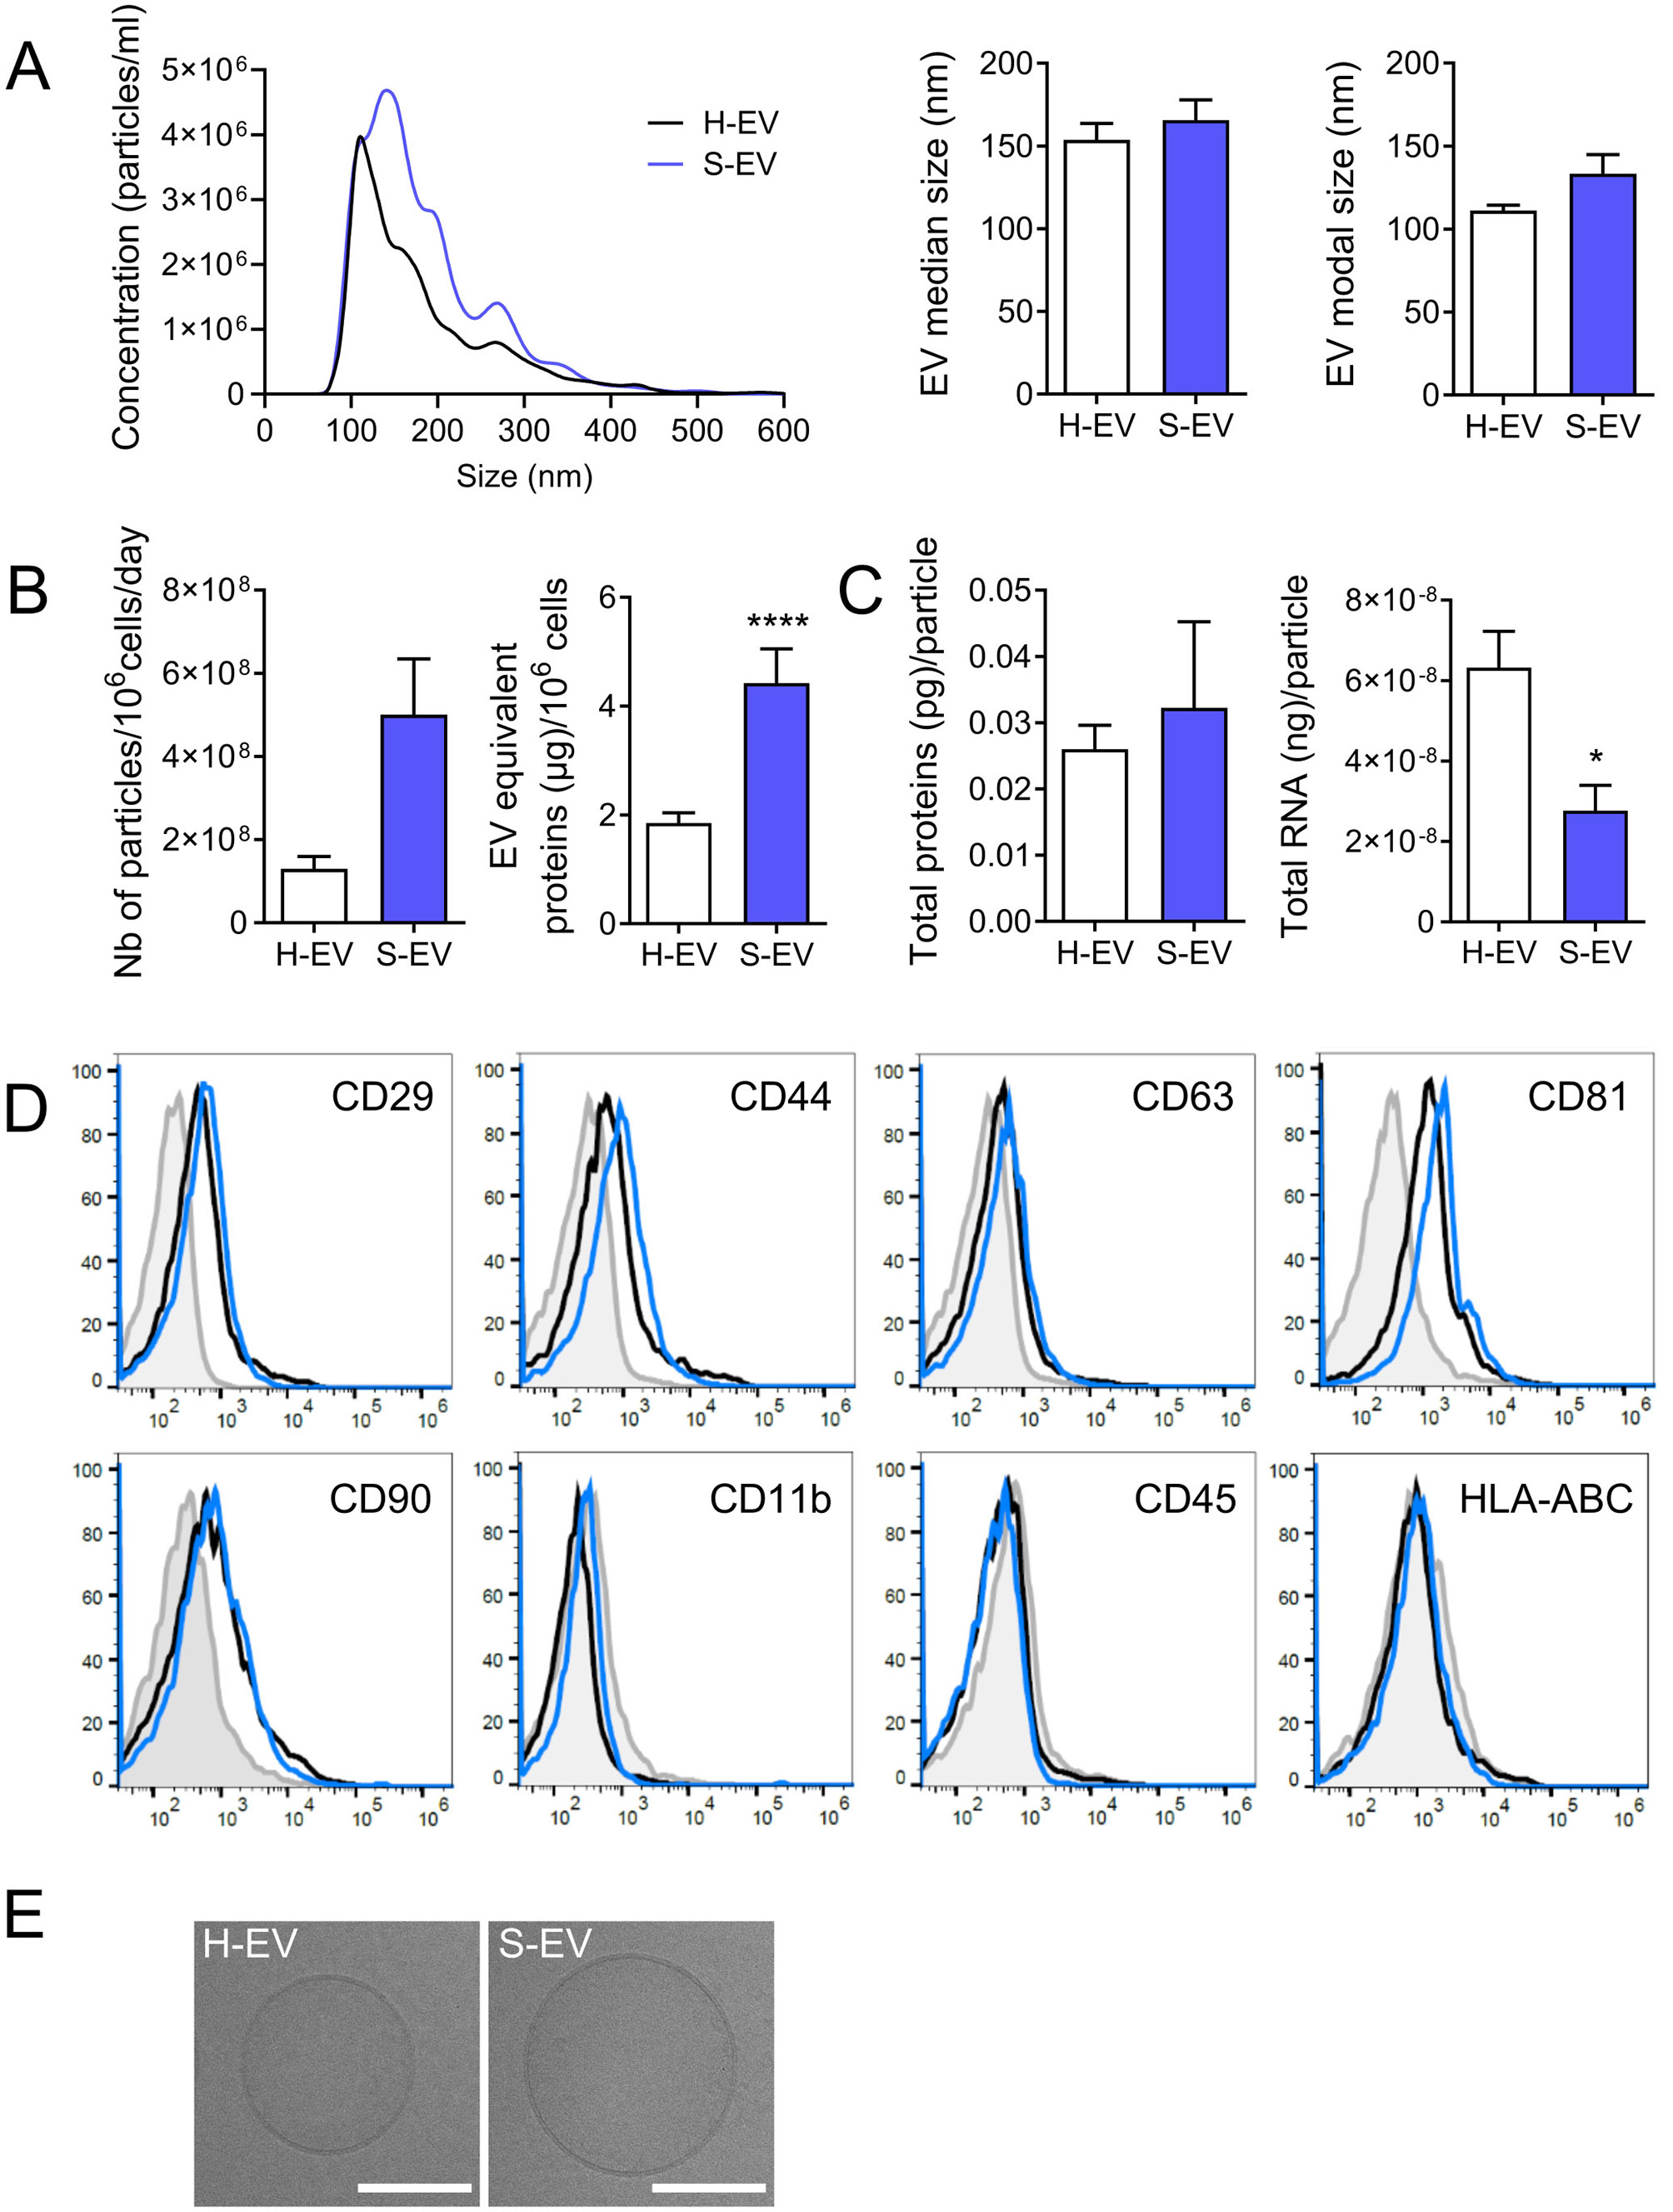
Fig. 2.

Characterization of extracellular vesicles isolated from human ASCs. (A) Size distribution of EVs isolated from healthy ASCs (H) or ETO-induced senescent ASCs (S) by Nano Tracking Analysis. The median and modal sizes of EVs are shown in the middle and right panels, respectively (n = 3). (B) EV numbers produced by 1 million ASCs per day (left panel) (n = 3) or EV equivalent in µg of proteins produced by 1 million ASCs (right panel) (n = 20–23). (C) Quantity of total proteins (left panel) and total RNA (right panel) produced per particle (n = 3). (D) Expression profile of membrane markers on the surface of H-EVs (black line), S-EVs (Blue line) or isotypic control (grey histogram) by FACS. (E) Representative pictures of H-EVs and S-EVs by cryo-transmission electron microscopy (scale bar: 100 nm). Data are shown as mean ± SEM. Statistical analysis used the Mann-Whitney test. *p < 0.05, ****p < 0.0001
