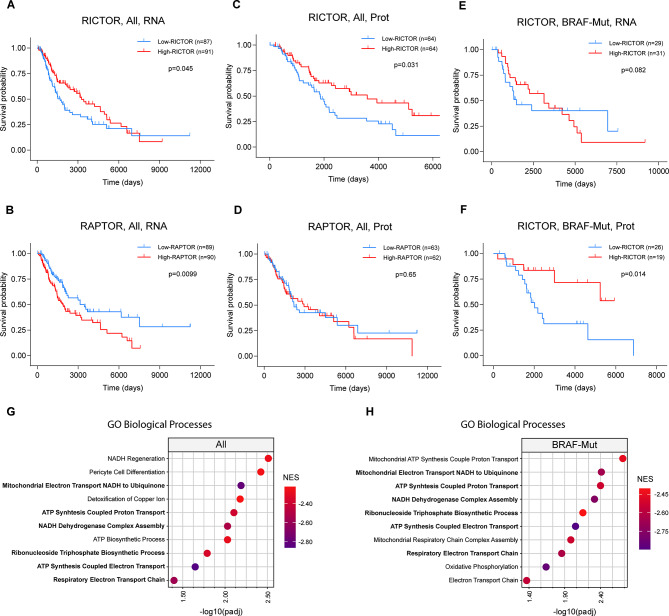
Fig. 1.
Analysis of Melanoma patients’ data from the TCGA database. (A-F) Kaplan-Meier survival analysis of the metastatic Skin Cutaneous Melanoma (SKCM) dataset obtained from TCGA patients’ database. A-D curves were obtained from analysis of the whole TCGA database irrespective of BRAF mutational status (All); E-F curves include only patients with reported BRAF Hotspot Mutations (BRAF-Mut); A, B, E curves were obtained from gene expression database (RNA); C, D, F were obtained from Reverse Phase Protein Array (RPPA) data. Patients were stratified into High and Low RICTOR-expressing groups based on average RNA/Protein expression levels. High-RICTOR/RAPTOR = fourth quartile; Low-RICTOR/RAPTOR = first quartile. Number of patients for each group and p-value calculated by Log-rank test are indicated in individual graphs. (G-H) Dotplots indicate the top 10 most significantly enriched Gene Ontology (GO) categories anticorrelated with RICTOR expression, in the (G) whole dataset (All; n = 367) or (H) after filtering for BRAF Hotspot Mutations (BRAF-Mut; n = 118). NES = Normalized Enrichment Score

