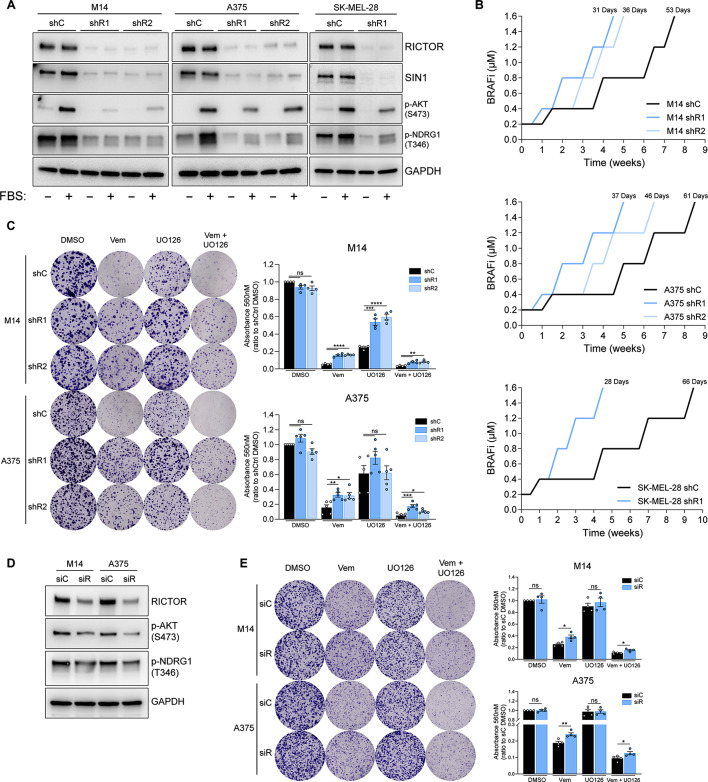
Fig. 2.
Downregulation of RICTOR in BRAFV600E melanoma cell lines promotes resistance to BRAF/MEKi. (A) Western blot analysis of indicated cell lines transduced with RICTOR-targeting shRNAs (shR1, shR2) or scramble control (shC) lentiviruses. Cells were analyzed after 24 h of serum starvation (-) or 24 h of serum starvation followed by 15 min of refeeding (+). (B) Resistance acquisition kinetics analysis of RICTOR-silenced (shR1, shR2) or control (shC) M14/A375/SK-MEL-28 cells exposed to increasing doses of BRAFi (Vemurafenib, from 0.2 to 1.6 µM). The number of days required to reach resistance to 1.6 µM Vemurafenib is indicated on top of each curve. (C) Colony Formation Efficiency (CFE) assay of indicated cell lines cultured for 12 days in presence of vehicle control (DMSO), 0.5 µM Vemurafenib (Vem), 0.5 µM UO126 (UO126) or the combination of 0.5 µM Vemurafenib + 0.5 µM UO126 (Vem + UO126). Bar graphs represent the mean values of independent experiments ± SEM (n = 4 for M14 cells; n = 5 for A375 cells). ns = not significant, *p < 0.05, **p < 0.01, ***p < 0.001, ****p < 0.0001, one-way ANOVA followed by Dunnett’s multiple comparisons test. (D) Western blot analysis of indicated cell lines transfected with a RICTOR-targeting (siR) or Non-targeting control (siC) siRNAs at 72 h after transfection. (E) CFE assay of indicated cell lines cultured for 7 days in presence of DMSO, Vem, UO126 or the combination of Vem + UO126 as in (C). Bar graphs represent the mean values of 4 independent experiments ± SEM. ns = not significant, *p < 0.05, **p < 0.01, unpaired t test

