Fig. 3.
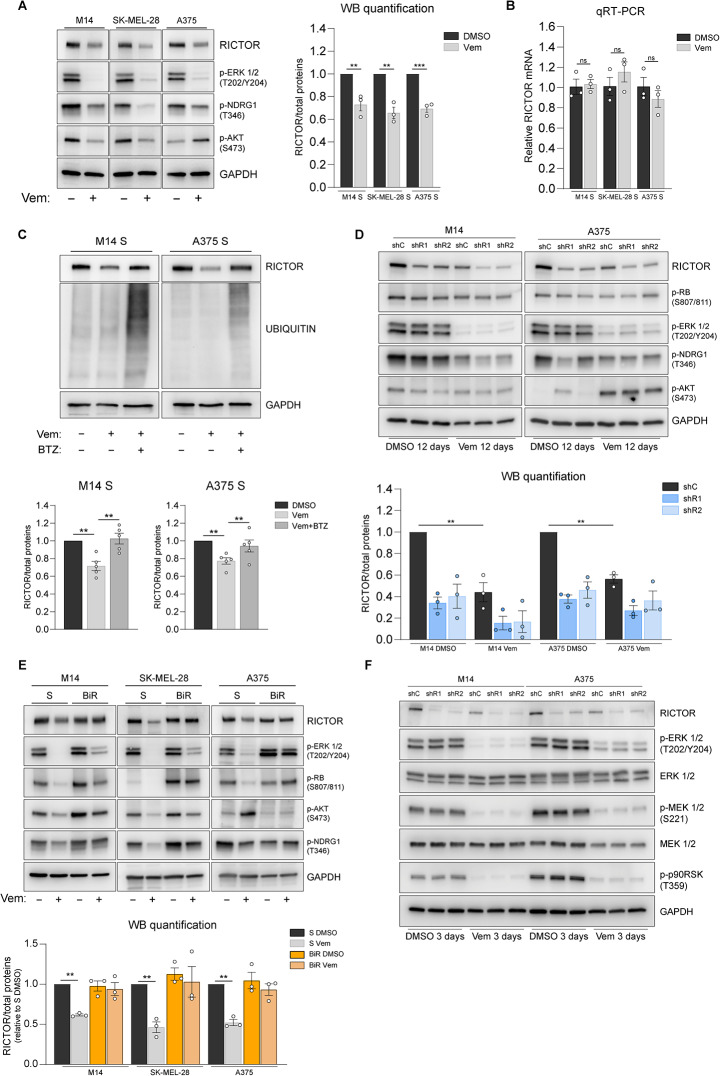
RICTOR protein downregulation occurs in drug-naïve BRAFV600E melanoma cells as a consequence of MAPK pathway inhibition. (A) Western blot analysis of indicated cell lines treated with (-) DMSO or (+) with 1.6 µM Vemurafenib (Vem) for 72 h. Images are representative of 3 independent experiments. See right panel for quantification. (B) Quantitative reverse transcription PCR (qRT-PCR) analysis of RICTOR gene expression in the indicated cell lines treated for 72 h either with DMSO or 1.6 µM Vemurafenib (Vem). Bar graphs represent the mean values of 3 independent experiments ± SEM. ns = not significant, one-way ANOVA followed by Dunnett’s multiple comparisons test. (C) Upper panel: western blot analysis of indicated cell lines treated for 48 h with 1.6 µM Vem ± 10 nM Bortezomib (BTZ). Lower panel: bar graphs show the mean values of densitometric analysis of RICTOR from 5 independent experiments ± SEM. **p < 0.01, one-way ANOVA followed by Dunnett’s multiple comparisons test. (D) Western blot analysis of indicated cell lines. Cells were cultured for 12 days in presence of either DMSO or 0.5 µM Vem. (E) Western blot analysis of Vemurafenib-sensitive (S) and -resistant (BiR) BRAFV600E melanoma cell lines treated for 72 h with (-) DMSO vehicle or (+) 1.6 µM Vemurafenib (Vem) (F) Western blot analysis of indicated cell lines treated for 72 h either with DMSO or 0.5 µM Vem

