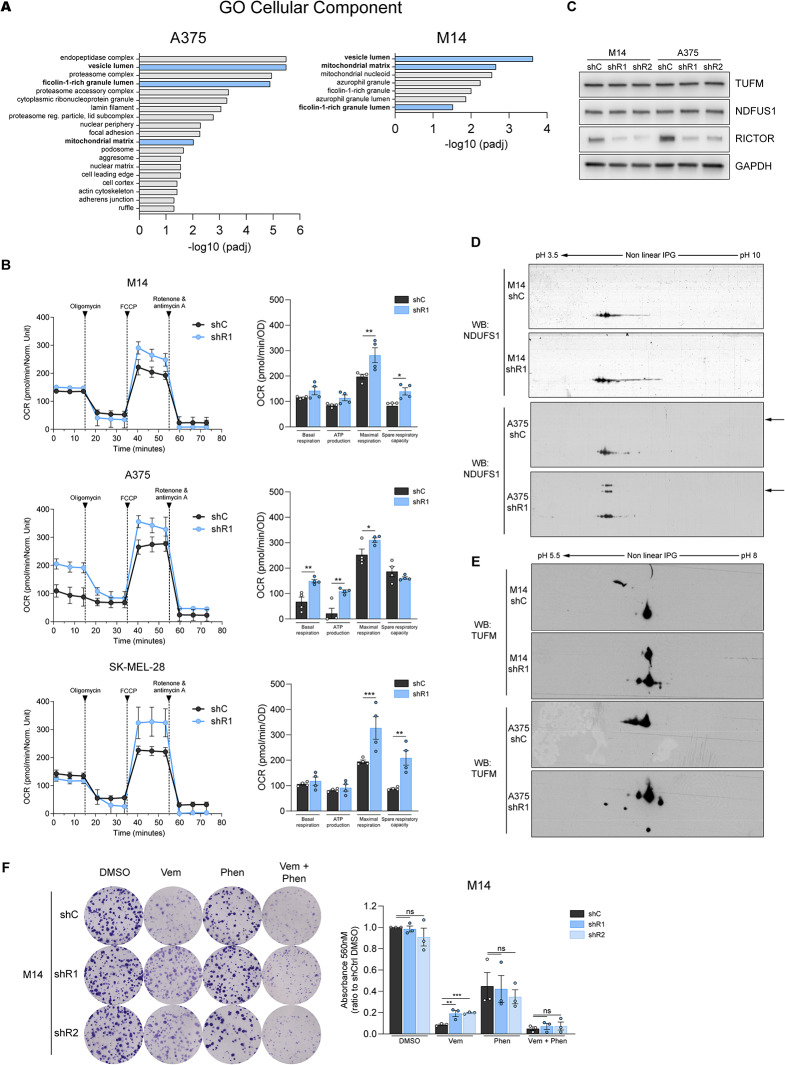
Fig. 4.
RICTOR depletion in BRAFV600E melanoma cells induces alterations in mitochondrial functions and protein profiles. (A) Significantly enriched gene ontology (GO) categories of differentially expressed protein species identified by MALDI-ToF MS in shR1 M14 and A375 cells. Blue bars indicate GO terms in common between the two lineages. Redundant enriched terms relative to identical subsets of proteins have been omitted. (B) Oxygen consumption rate (OCR) measurement performed on indicated cell lines using Seahorse XFp analyzer. Bar graphs represent indicated functional parameters calculated from the same measurements (n = 4). *p < 0.05, **p < 0.01, ***p < 0.001 one-way ANOVA followed by Sidak’s multiple comparisons test (C) Western blot analysis performed on indicated cell lines under basal conditions. (D, E) Western blot analysis of NDUFS1 (D) and TUFM (E) proteins in the indicated cell lines performed after 2D-Gel electrophoresis (2D-GE) under basal conditions. Arrows indicate NDFUS1 proteoforms with different molecular weights. See Fig S4B-D for quantification of western blots shown in C-E. (F) CFE assay of indicated cell lines cultured for 12 days in presence of DMSO, 0.5 µM Vemurafenib (Vem), 200 µM Phenformin (Phen) or the combination of 0.5 µM Vemurafenib + 200 µM Phenformin (Vem + Phen). Bar graphs represent the mean values of 3 independent experiments ± SEM. **p < 0.01, ***p < 0.001, one-way ANOVA followed by Dunnett’s multiple comparisons test

