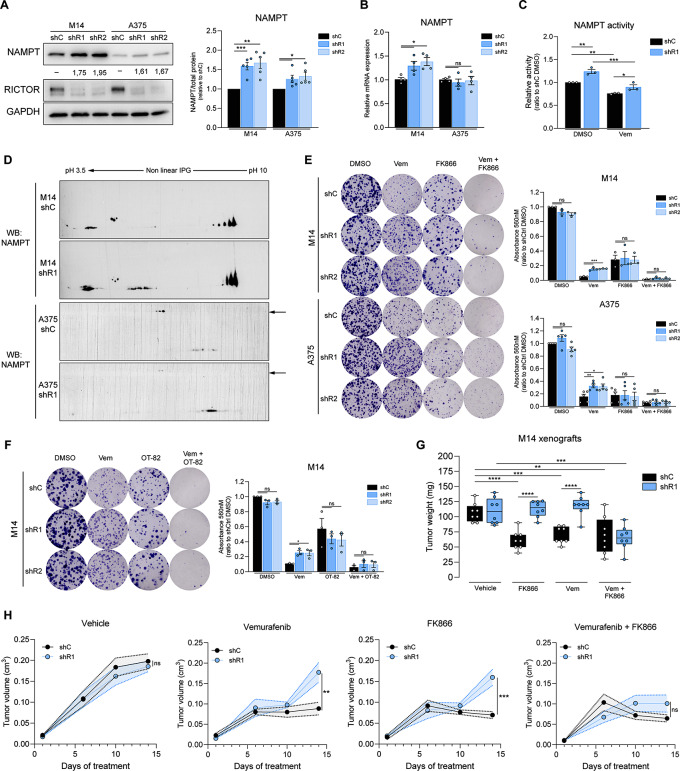
Fig. 5.
RICTOR silencing in BRAFV600E melanoma cell lines leads to increased NAMPT activity which can be pharmacologically inhibited to restore sensitivity to BRAFi. (A) WB analysis performed on indicated cell lines under basal conditions. Densitometric quantification of NAMPT band intensity is indicated below each band. Right panel: densitometric quantification of WB, each value was normalized on shC cells of the same lineage. Bar graphs represent the mean values of 5 independent experiments ± SEM. *p < 0.05, **p < 0.01, ***p < 0.001, one-way ANOVA followed by Dunnett’s multiple comparisons test. (B) qRT-PCR analysis of NAMPT gene expression in the indicated cell lines under basal conditions. Bar graphs represent mean values of 4 independent experiments ± SEM. *p < 0.05, one-way ANOVA followed by Dunnett’s multiple comparisons test. (C) NAMPT enzymatic activity of M14 cells treated for 24 h with 5 µM Vemurafenib (Vem) or vehicle control (DMSO), normalized on untreated shC cells. Bar graphs represent mean values of 3 independent experiments ± SEM. *p < 0.05, **p < 0.01, ***p < 0.001, two-way ANOVA followed by Tukey’s multiple comparisons test. (D) WB analysis of NAMPT protein in the indicated cell lines performed after 2D-GE under basal conditions. Arrows indicate NDFUS1 proteoforms with different molecular weights. See Fig S5B for quantification. (E) CFE assay of indicated cell lines cultured for 12 days in presence of DMSO, 0.5 µM Vem, 2.5 nM FK866 or the combination of 0.5 µM Vem + 2.5 nM FK866 (Vem + FK866). Bar graphs represent the mean values of independent experiments ± SEM (n = 3 for M14 cells; n = 4 for A375 cells). *p < 0.05, **p < 0.01, ***p < 0.001, ****p < 0.0001, one-way ANOVA followed by Dunnett’s multiple comparisons test. (F) CFE assay of M14 cells cultured for 12 days in presence of DMSO, 0.5 µM Vem, 1.2 nM OT-82 or the combination of 0.5 µM Vem + 1.2 nM OT-82 (Vem + OT-82). Bar graphs represent the mean values of 3 independent experiments ± SEM. *p < 0.05, one-way ANOVA followed by Dunnett’s multiple comparisons test. (G) Tumor weights of tumor xenografts of shC or shR1 M14 cells in NSG mice (n = 8 mice/group), treated for 14 days with the indicated drugs. **p < 0.01, ***p < 0.001, ****p < 0.0001, two-way ANOVA followed by Tukey’s multiple comparisons test. (H) Growth curves of M14 shC or shR1 xenografts used for tumor weight measurement, each graph refers to the treatment indicated at the top. *p < 0.05, **p < 0.01, two-way ANOVA followed by Tukey’s multiple comparisons test performed at the experimental endpoint

