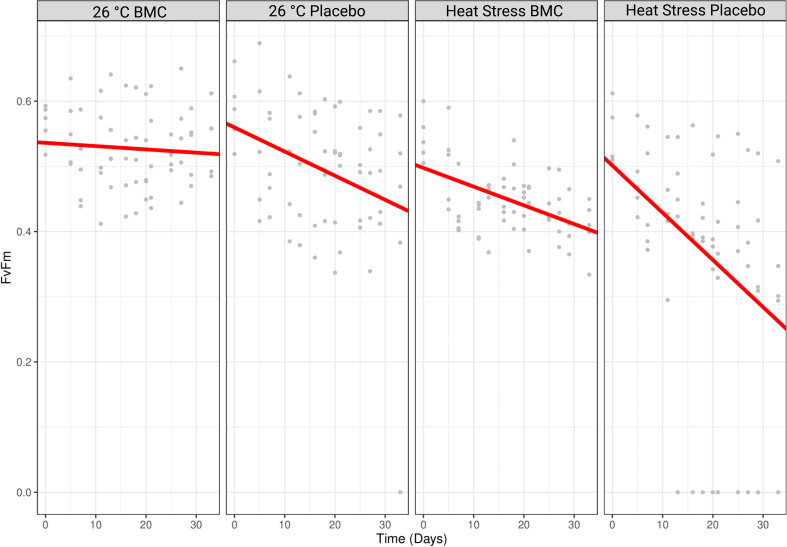
Fig 6.
Fv/Fm values of coral fragments treated with a placebo or the BMC consortium and exposed to heat stress or maintained at a constant temperature of 26°C (n = 5). Gray dots represent the specific Fv/Fm values found for each replicate during different timepoints of the experiment. Red lines represent the fit of a mixed-effect linear model.

