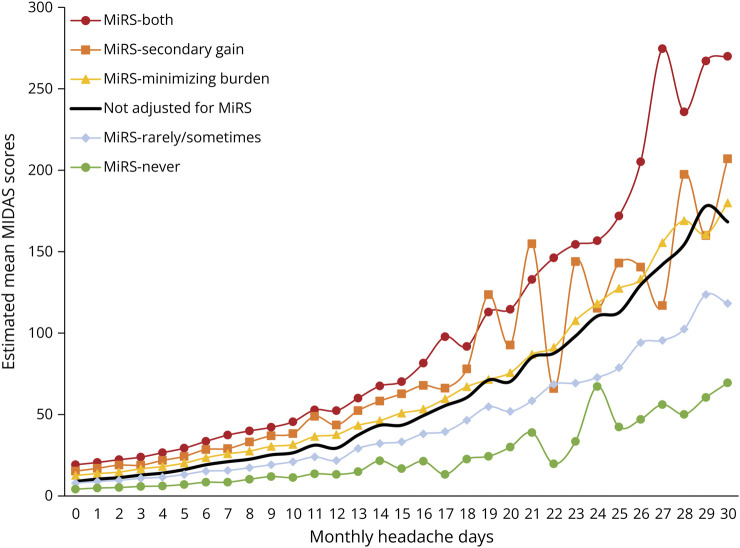
Figure 3. Estimated Mean MIDAS Scores Across Monthly Headache Days (n = 59,001).
The negative binomial regression model was run adjusting for age, sex, race (White, Black, Other Races), ethnicity (Hispanic, Latino/Spanish), metropolitan/micropolitan/rural residence, geographic region (northeast, midwest, south, west), education (high school degree or less, some college, college graduate), marital status (married or living with a partner vs no), children younger than 18 years living at home (yes vs no), income, health insurance (yes vs no), employment (full time, part-time, homemaker, retired, other), BMI (normal/underweight, overweight, obese), sum of self-reported comorbidities (0–26 total), PHQ-4 total score (range 0–12), and monthly headache day frequency. BMI = body mass index; MIDAS = Migraine Disability Assessment; MiRS = Migraine-Related Stigma; PHQ-4 = Patient Health Questionnaire.

