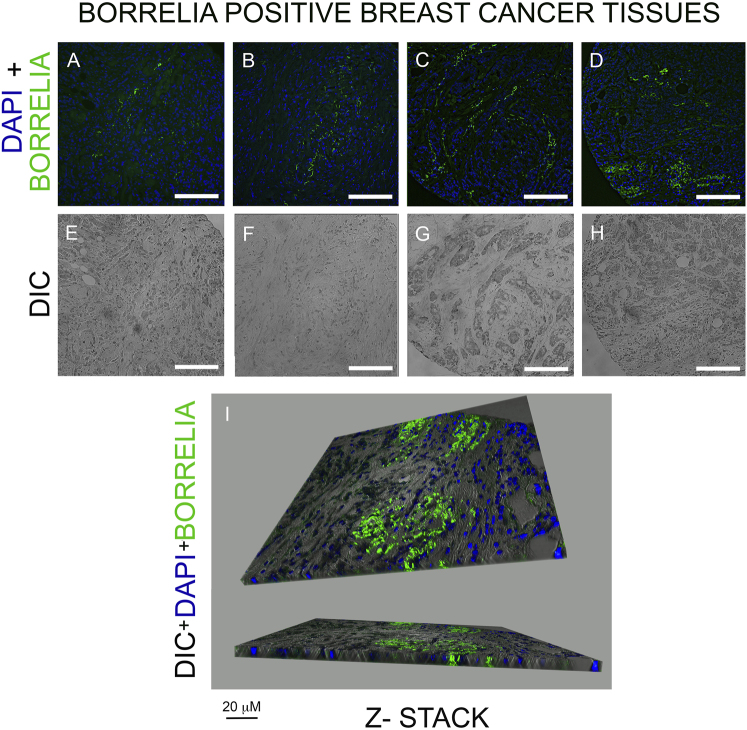
Fig. 2.
Representative images of B. burgdorferi-specific IHC staining of breast cancer tissue array. Panels A–D: Merged DAPI (blue nuclei staining) and B. burgdorferi (green staining) showing the localization of B. burgdorferi spirochetes and aggregates in breast cancer tissues Panels E–H: Differential interference microscopy (DIC) demonstrating the size and tissue morphology of the corresponding tissues. Panel I: A representative Leica Thunder Z-stack 3D image of B. burgdorferi-positive breast cancer tissue (Panel D). White scale bar: 100 µm

