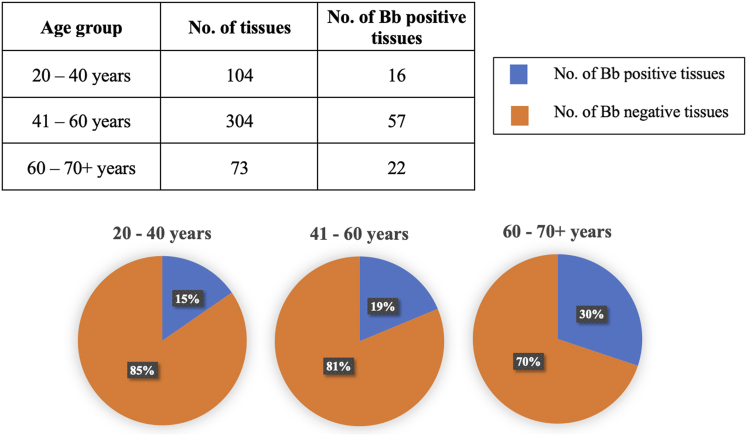
Fig. 8.
Comparison of B. burgdorferi-positive samples identified across various age groups ranging from 20 to 70+ years. The pie charts illustrate the percentages of B. burgdorferi-positive tissues (depicted in blue) relative to the total number of tissues within each age group. Additionally, the table above provides the numerical tissue count and the number of B. burgdorferi-positive samples in each age group

