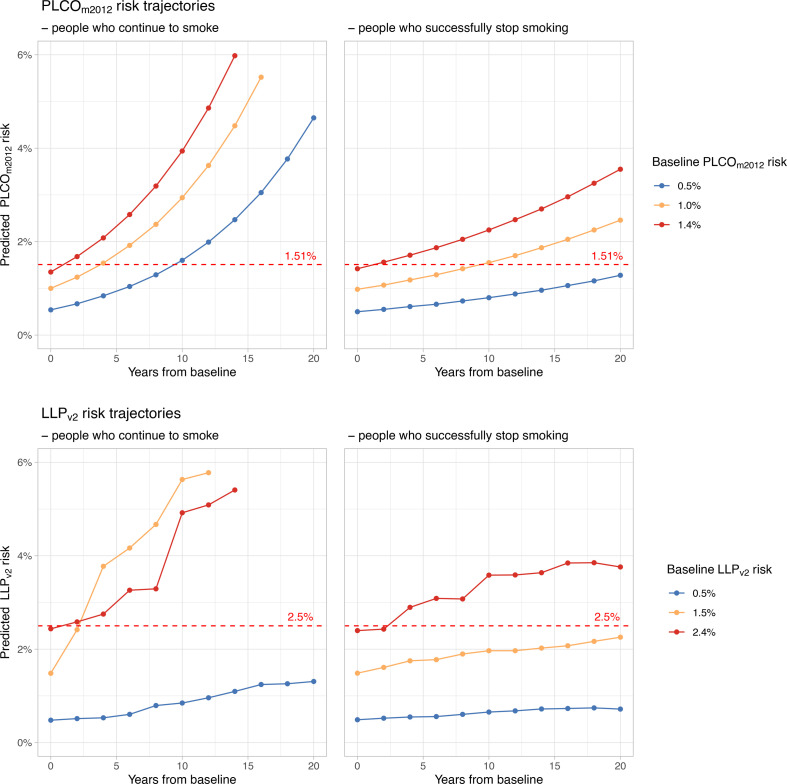
Figure 2.
Lung cancer risk trajectories predicted by PLCOm2012 and LLPv2 according to smoking status. For participants with each example baseline risk score, mean risks were calculated over subsequent years to display when screening eligibility may be reached (crossing the dashed red line). The y-axes are limited to display the eligibility thresholds more clearly. LLPv2, Liverpool Lung Project version 2; PLCOm2012, Prostate, Lung, Colorectal and Ovarian trial’s risk model 2012.

