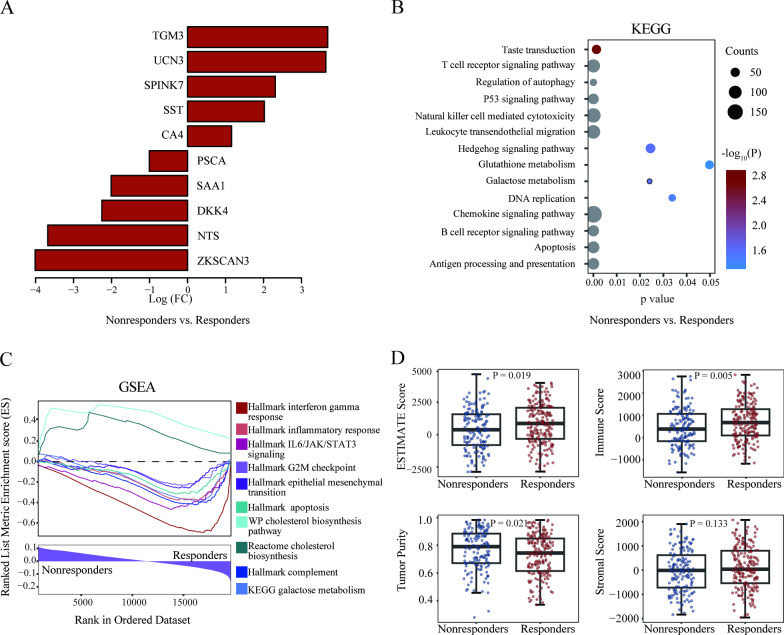
Figure 6.
Pathogenomics analysis of the pathomics-driven ensemble model. (A) The differentially expressed genes between responders and non-responders. (B) Visualization of the top enriched KEGG pathways by gene counts along with p values in responders versus non-responders. (C) Gene Set Enrichment Analysis delineated the molecular pathways significantly associated with the pathomics-driven ensemble model. (D) Associations between the pathomics-driven ensemble model and immune-related characteristics. ESTIMATE score, immune score, stroma score, and tumor purity were presented in responders versus non-responders. ESTIMATE, Estimation of STromal and Immune cells in MAlignant Tumor tissues using Expression data; GSEA, Gene Set Enrichment Analysis; KEGG, Kyoto Encyclopedia of Genes and Genomes.

