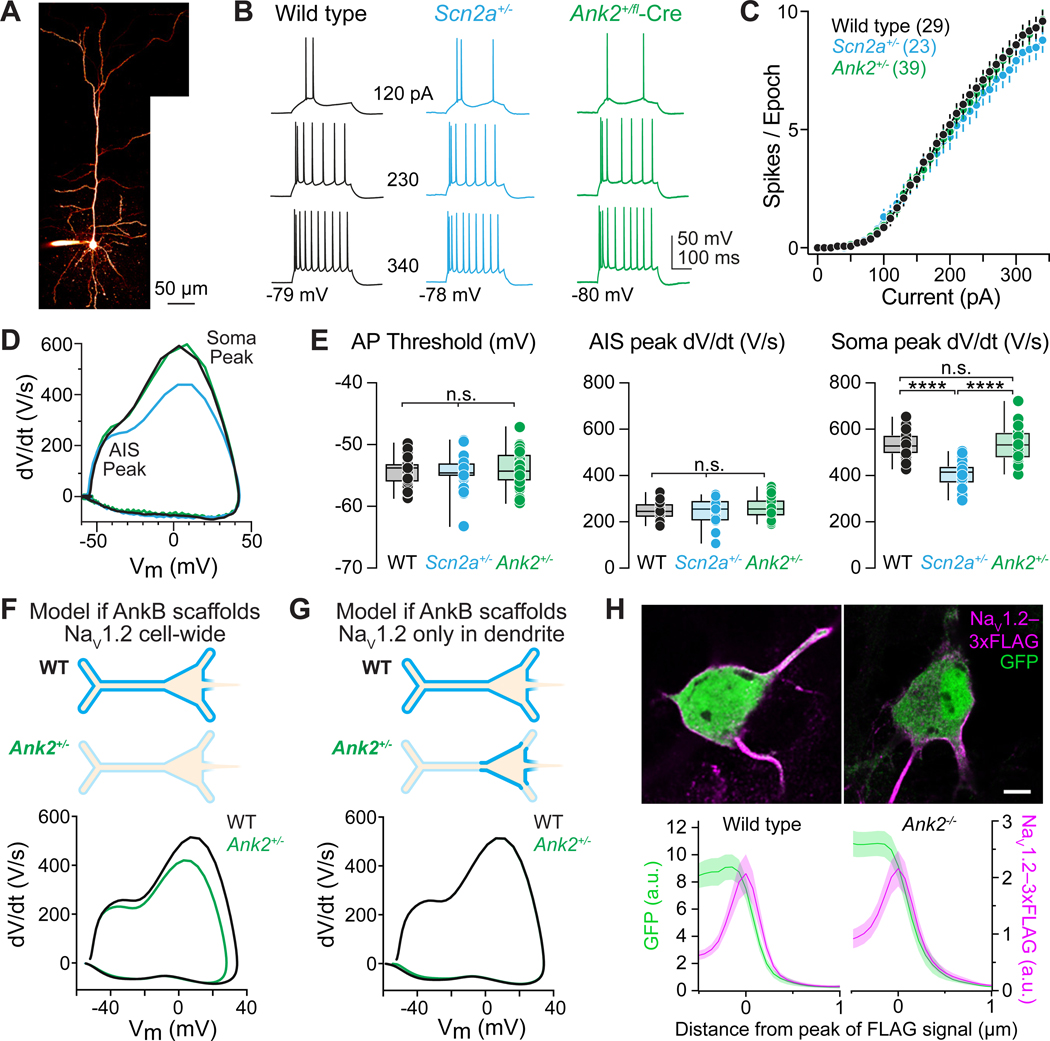
Figure 4: Ank2 haploinsufficiency has no effect on axonal or somatic excitability.
(A) 2-photon maximum intensity z-stack of a layer 5 thick-tufted pyramidal neuron in mPFC, filled with Alexa-594 via whole-cell pipette.
(B) APs generated by current injection (0–340 pA, 10 pA intervals, 300 ms) in WT, Scn2a+/−, and Ank2+/fl-Cre in P43–75 L5 neurons.
(C) APs per 300 ms epoch versus amplitude of current injection as in (B). Firing-rate slope between 0–340 pA: (WT: 0.033±0.002 Hz/pA, n=29 cells, N=14 mice; Scn2a+/−: 0.03±0.002 Hz/pA, n=23 cells, N=8 mice; Ank2+/fl-Cre: 0.033±0.001, n=39 cells, N=16 mice). No significant differences.
(D) Phase-plane plots (dV/dt vs. voltage) of somatic APs from WT (black), Scn2a+/− (cyan), and Ank2+/fl-Cre (green) neurons. Different phases of the AP correspond to AP initiation in the AIS (first peak) and soma (second peak).
(E) Left: Quantification of AP threshold (mV) from the first AP evoked by near-rheobase current in P43–75 WT, Scn2a+/−, and Ank2+/fl-Cre L5 neurons. Circles represent single cells. (WT: −54.4±0.4 mV, n=27 cells; Scn2a+/: −54.5±0.4 mV, n=23 cells; Ank2+/fl-Cre: −53.9±0.5 mV, n=39 cells). No significant differences. Middle: AIS AP peak dV/dt (V/s). (WT: 248.7±7.1 V/s, n=27 cells; Scn2a+/−: 242.2±12.3 V/s, n=23 cells; Ank2+/fl-Cre: 257.6±6.8 V/s, n=39 cells). No significant difference. Right: Somatic AP peak dV/dt (V/s). (WT: 537.8±11.3 V/s, n=27 cells; Scn2a+/−: 406.4±11.3 V/s, n=27 cells, Ank2+/fl-Cre: 535.1±10.8 V/s, n=40 cells). WT vs. Scn2a+/− ****p<0.0001, Scn2a+/− vs. Ank2+/fl-Cre ****p<0.0001, WT vs. Ank2+/fl-Cre p=0.86.
(F) Compartmental modeling of the effects of NaV1.2 loss from both somatic and dendritic domains on AP waveform. Top: Schematic of NaV1.2 distribution across soma and dendrites in WT neurons compared to loss of NaV1.2 in all compartments in Ank2+/fl-Cre neurons. Bottom: Phase-plane plots from computational model of AP somatic peak dV/dt changes with WT and heterozygous NaV1.2 membrane density. No other channels or model parameters were altered except for NaV1.2.
(G) Modeling as in F, but now restricting NaV1.2 loss to dendrites alone. Note agreement of model with empirical data from Ank2+/fl-Cre neurons in E.
(H) Top: Confocal images of DIV21 WT and Ank2-null cultured neocortical neurons transfected with NaV1.2–3xFLAG-IRES-eGFP and immunostained for FLAG (magenta) and GFP (green). Images are single optical sections through the soma. Complete z-projection images are shown in Figure S3. Bottom: Somatic NaV1.2–3xFLAG and GFP mean fluorescence intensity (a.u.) in WT (left) and Ank2-null (right) neurons. Lines are means with SEM shadows of 1 μm-wide intensity profiles drawn orthogonal to the somatic membrane (2 lines per cell, 12 cells per condition).

